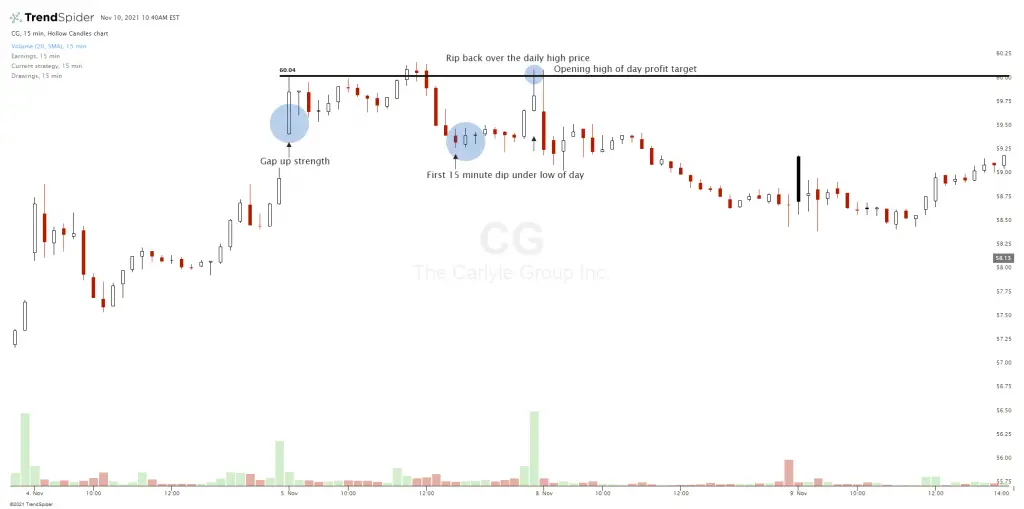
The dip and rip chart pattern starts with a strong opening (usually a gap up) that is followed by a quick dip in the price. The dip is followed by a fast return to the previous high price, and can even break out over that high.
Price dips first and then it rips. It can start strong then act weak after the open but then break the high of the day.
Many traders see a big gain in the premarket action and are eager to buy experiencing the FOMO of missing out on a big winner. These big premarket gainers can fade lower right after the big gap up open during the initial profit taking from the previous holders happy to exit with a large profit. Many early momentum chasers at the open get stopped out leading to the early dip. After the initial selling pressure is relieved the price levels out and starts reversing back higher with the next wave of intraday dip buyers.
The key to trading this pattern is waiting for the dip to go long. A trader must have the patience to wait until the waves of profit takers and earlier profiteers chasing the momentum are worked through or stopped out. Waiting at least 15 minutes to buy the dip is usually a good general rule for this pattern. Then after a long entry a stop loss can be placed below the day’s low and a profit target can be set for a return near the day’s opening high price or daily high.
