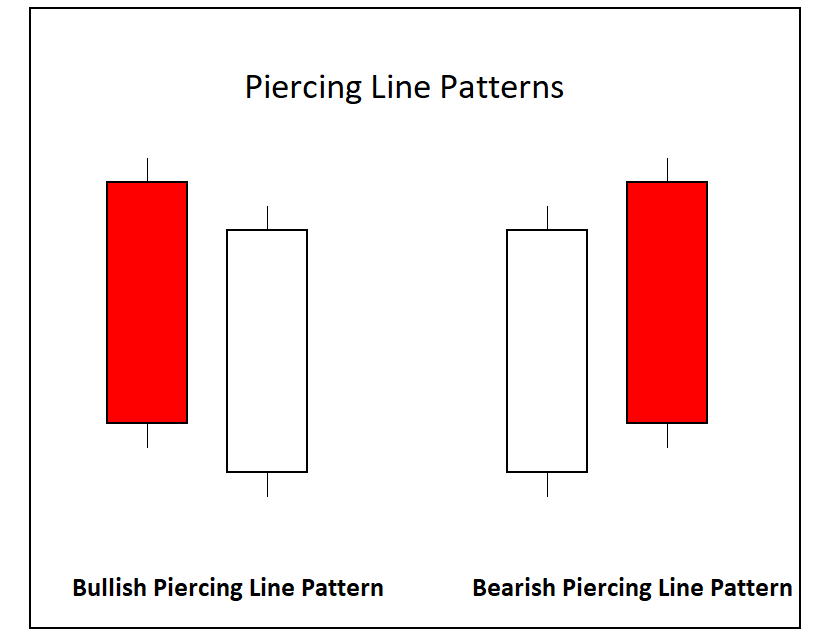
What is a Reversal Candlestick Pattern?
Reversal candlestick patterns are the formation of multiple candles which signal the potential end of the current directional swing or…
Helping Traders Thrive
Reversal candlestick patterns are the formation of multiple candles which signal the potential end of the current directional swing or…
There are four primary different types of the most popular used moving averages on charts by traders: Simple (SMA), Exponential…
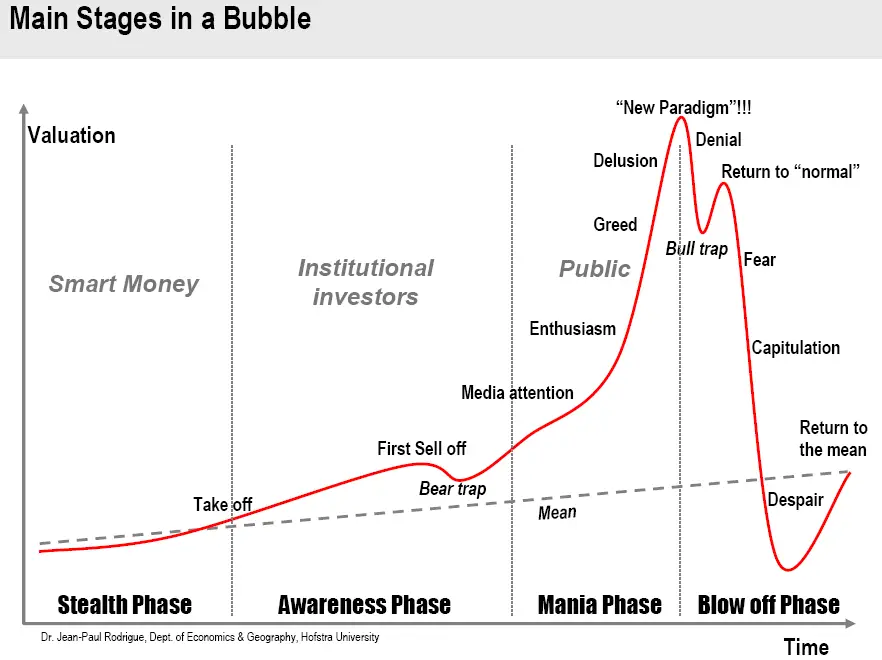
Market Bubble Stages Market bubbles go through four stages on charts. Stealth Phase The early stealth phase happens at the…
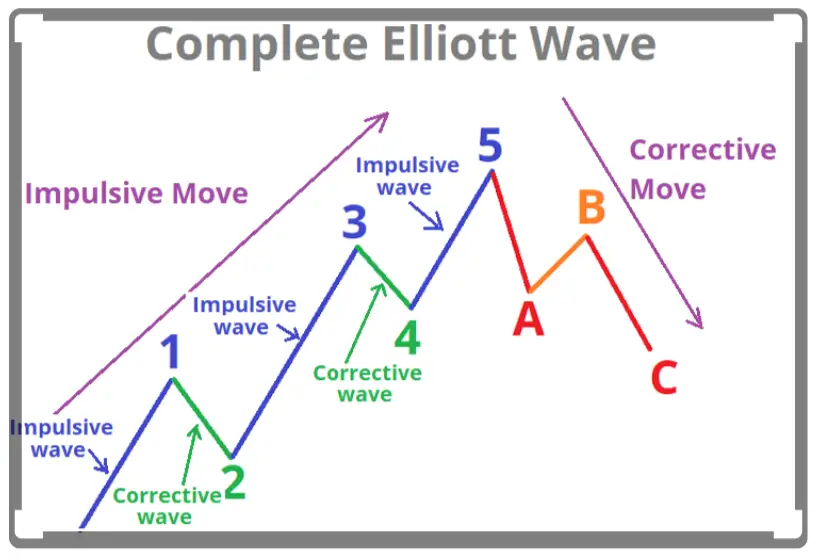
The Elliott Wave theory is a method of technical analysis that tries to quantify repeating long-term price action patterns correlated…
Technical analysis is a process used to quantify the price action on the chart of a security and identify trading…
This is a guest post by bapital.com Technical analysis can help a trader to analyze the market and find trading…
Options Delta Meaning What is delta in options? The delta of an option is part of the option Greek pricing…
Here is a great technical indicators cheat sheet graphic created by Tradeciety.com What are the 4 types of indicators? Trend…
This is a guest post by Christopher Russell of TheStockDork.com As an investor, you dedicate your hard-earned money to one…
This chart shows top investors returns or their Alpha versus the market returns. Image source www.dakotavalue.com What is Alpha Return?…