RSI Indicator Strategy
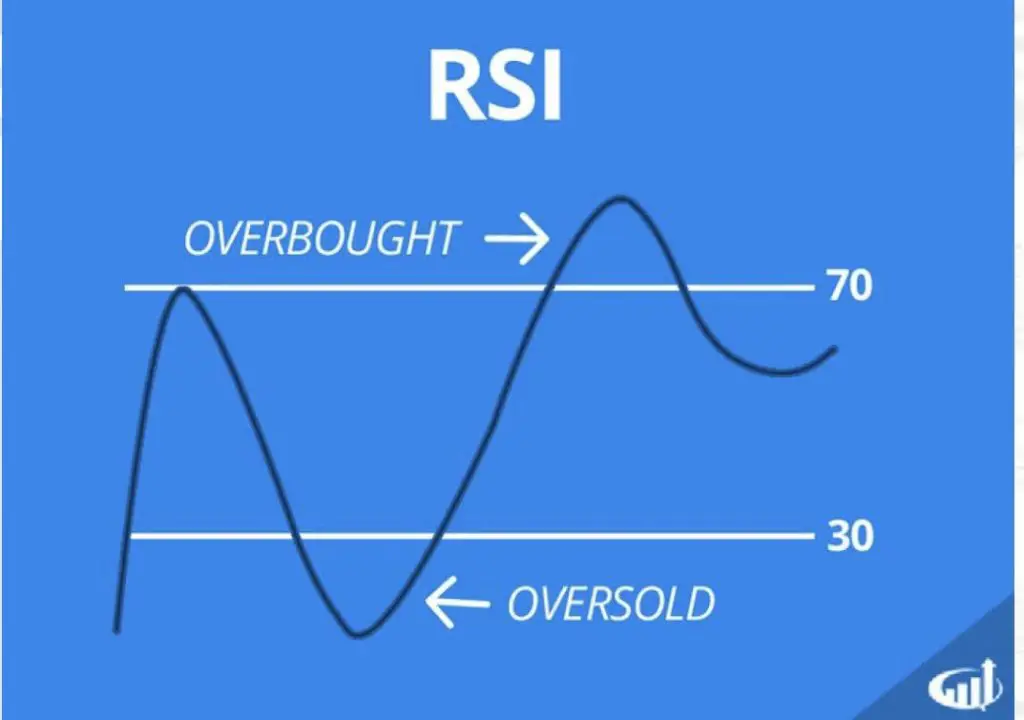
The RSI indicator strategy uses the Relative Strength Index to make buy and sell decisions on a chart based on…
Helping Traders Thrive
The RSI indicator strategy uses the Relative Strength Index to make buy and sell decisions on a chart based on…
When implied volatility for options pricing is high it is usually the best risk/reward ratio to look at selling option…
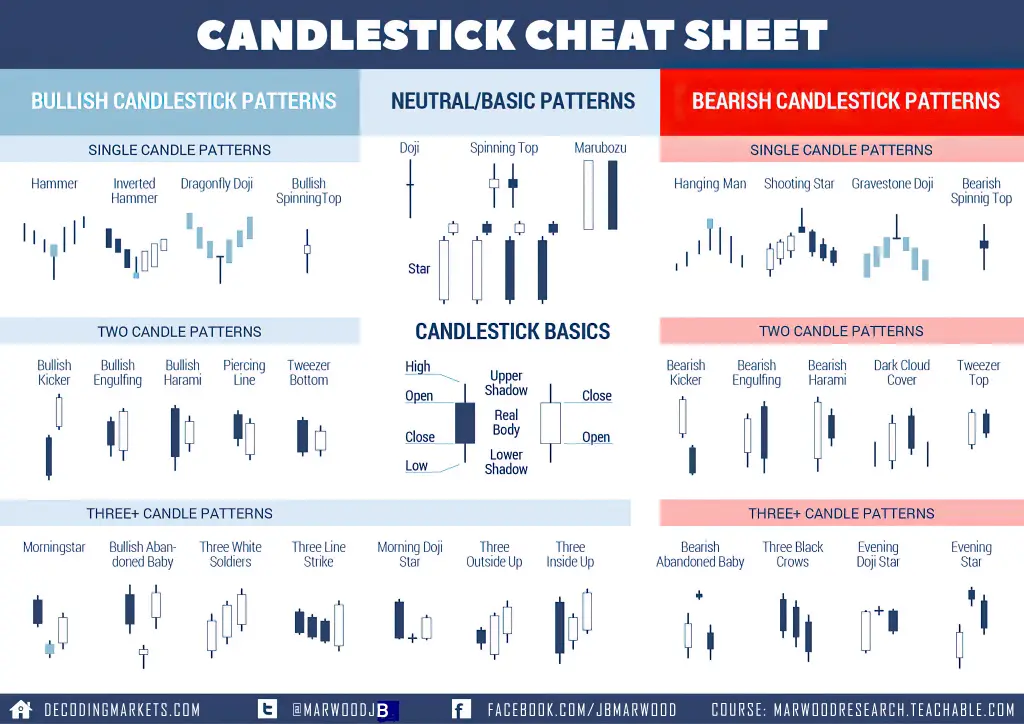
A candlestick is a type of chart used in trading as a visual representation of past and current price action…
A list of the current most shorted stocks right now can be a great place to look for potential deep dip value…
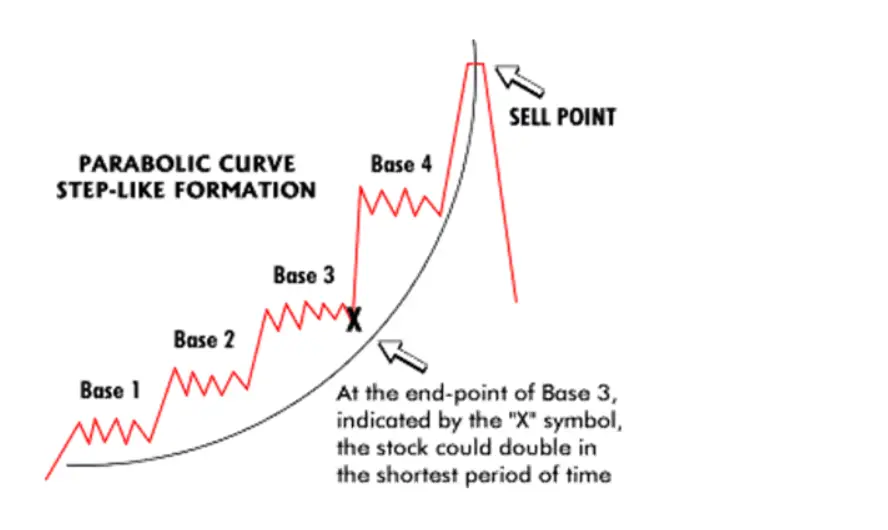
A parabolic curve in stocks is when a chart makes an upward price move that looks like the right side…
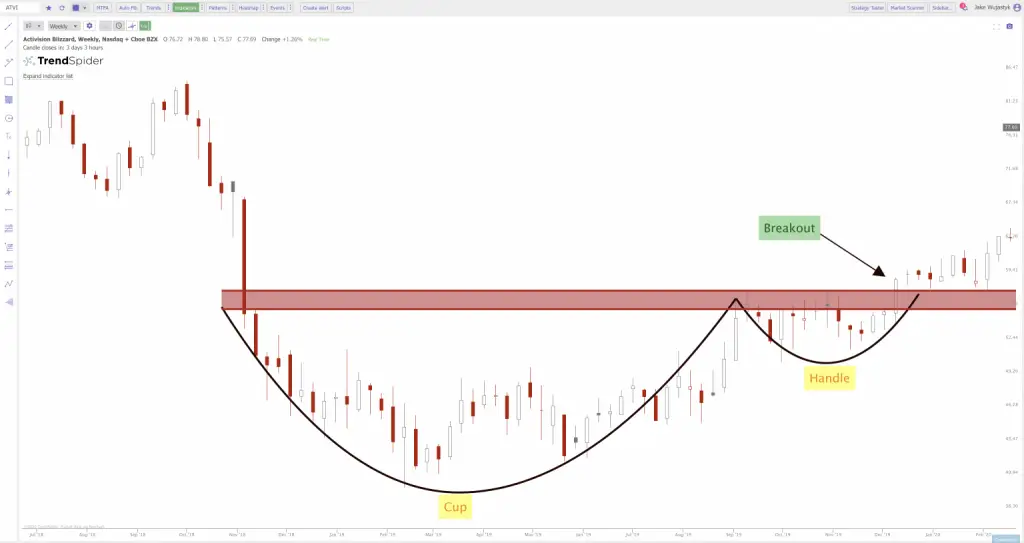
The cup and handle pattern is a bullish continuation pattern. This pattern gives a momentum buy signal as price action breaks…