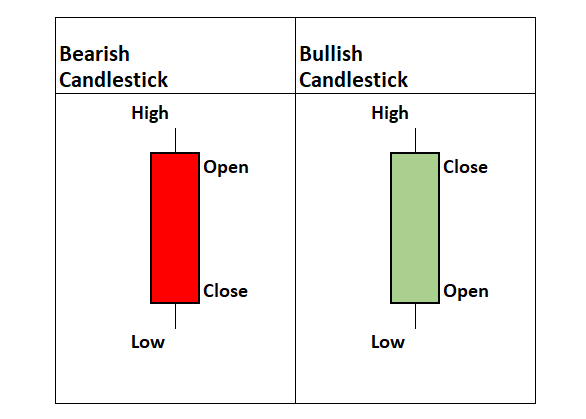
Candlesticks are a type of chart setting available on trading platforms that creates a visually representation of price action on a time period. A candlestick shows a contrast between the opening and closing prices along with any range outside the open or close. They are colored to show bullish or bearish action.
The three primary types of candlestick charts are as follows.
- Red/Green Candlesticks
- Hollow candlesticks
- Heikin Ashi
What do red and green candlesticks mean?

When using default candlestick settings the charts show price action as green when the close is higher than the open and as red when the close is lower than the open. This is a clear view of sentiment for each candle over successive days and if price is closing higher or lower versus opening prices consistently.
For traditional candlesticks the body of the candle reflects the opening and closing prices of the period and the wicks show the price action that is outside the open/close price range. Upper wicks show price action above the open and the close while lower wicks show price action under the open/close range.
What does a hollow candlestick mean?
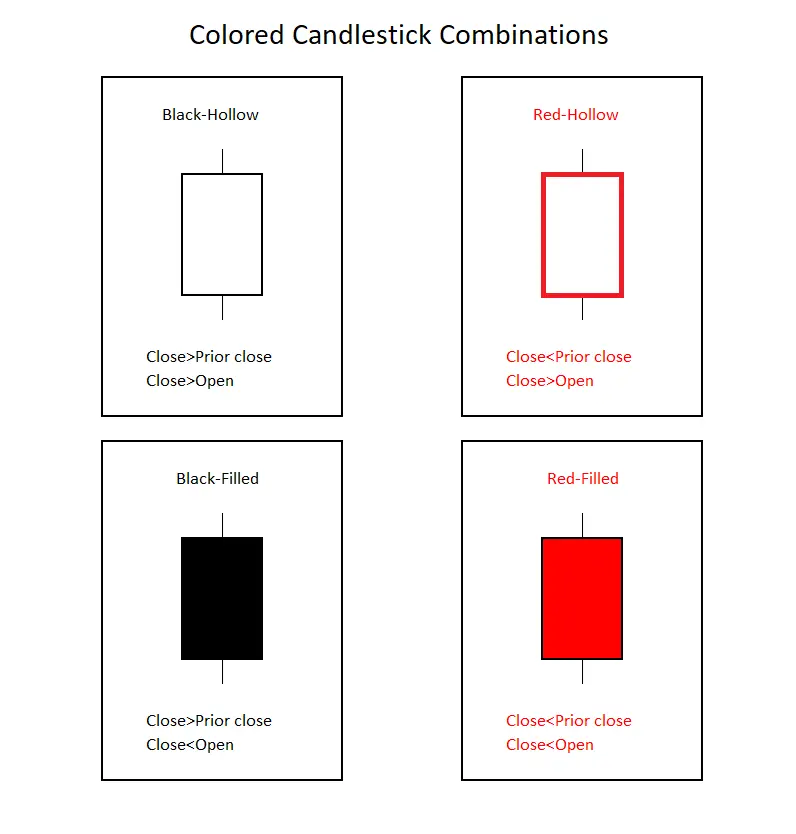
The hollow candlestick setting on a chart platform uses both hollow and filled candles to express more nuances in price action along with the colors, white, red, and black.

Hollow candlesticks are made up of four components in two groups. First, a close lower than the prior close gets a red candlestick and a higher close than the previous close gets a white candlestick. Second, a candlestick is hollow when the close is above the open and filled when the close is below the open. The above image shows the four possible hollow and filled candle combinations when using hollow candlestick chart settings.
Red-hollow candlesticks can show some bullish reversal price action on an overall bearish chart. Even as the closing price was lower than the previous close making the candle red the price action moved higher during the period after the open making it hollow. Even though it closed lower than the previous trading period, there was buying pressure near the lows that made it close higher than the open.
The solid black candle is the inverse price action of the red hollow candle. Even though the closing price was above the previous close making it black, price action did finish lower than the open to make it a black filled candle. Even though a black filled candle closes higher on the current period versus the previous period, it does show selling pressure after the opening price. This candle shows rejection of intraday highs and can be a standalone signal of a bearish reversal during an upswing or uptrend in price action especially near new highs in price.
There are four types of hollow candlesticks:
- Hollow candles occur when the price closed higher than it opened.
- Filled candles occur when the price closed lower than it opened.
- White candles occur when the price closed higher than the prior close.
- Red candles occur when the price closed lower than the prior close.
Note that white candles have black outlines and will at times also be called hollow black candles.
Hollow candlesticks show bullish and bearish sentiment of the open and the close for the current period in contrast to the previous period.
How do you read a Heiken Ashi?

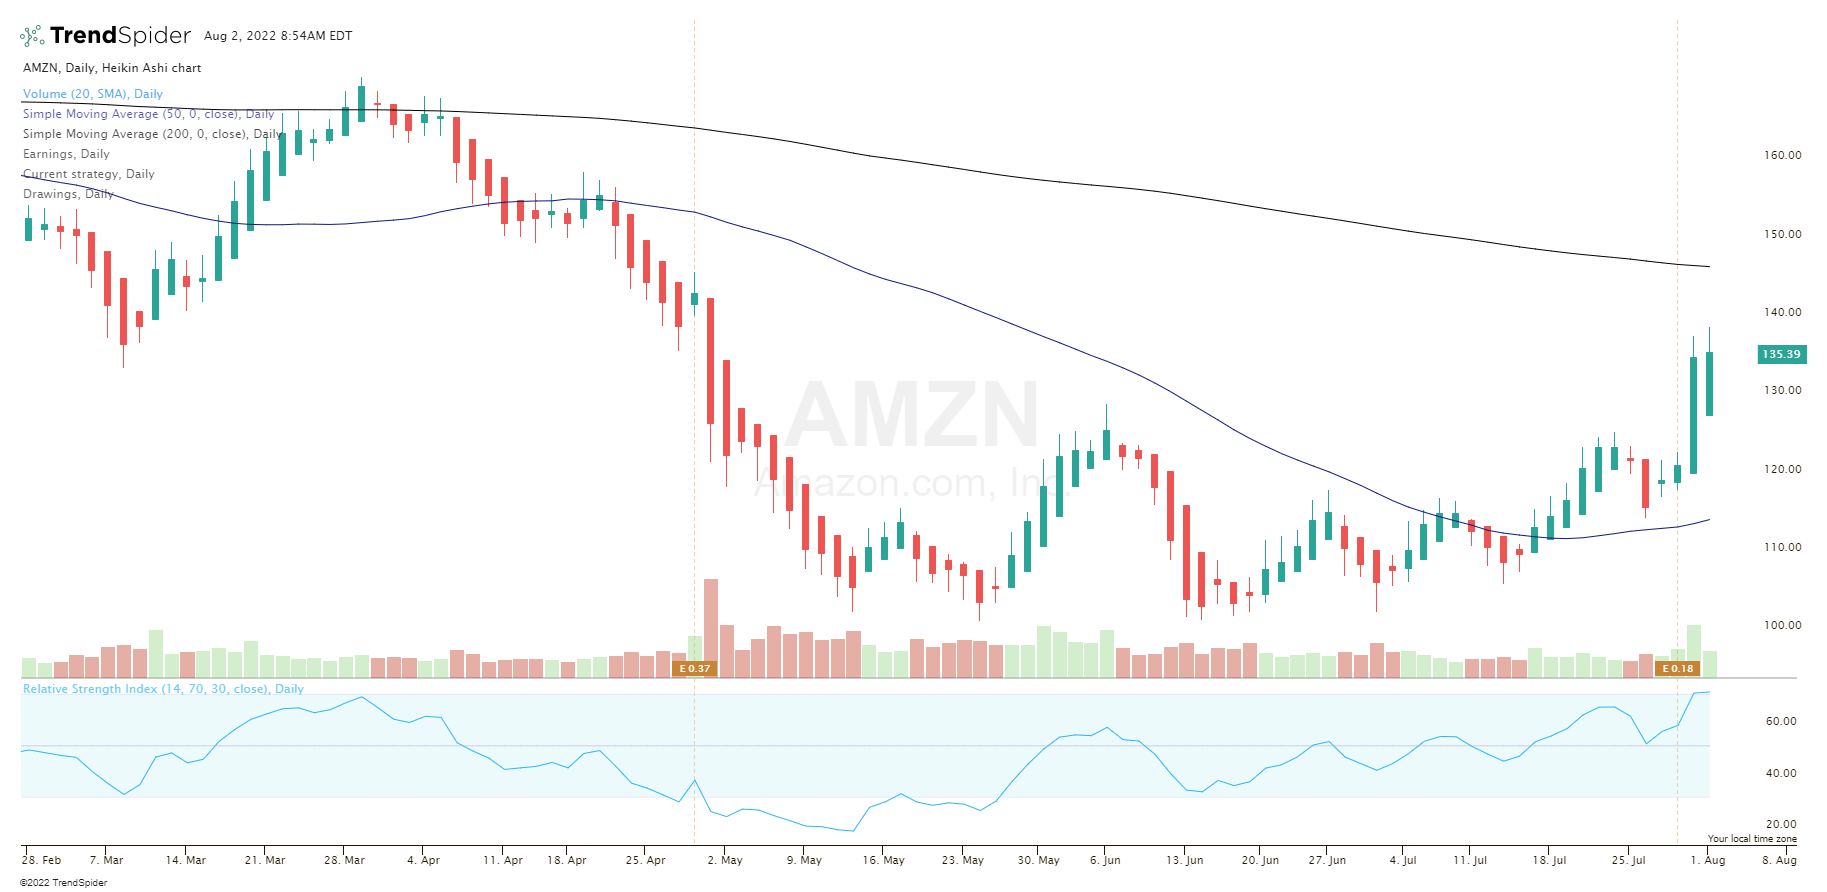
Heikin Ashi candlestick charts are a different variation of traditional Japanese candlesticks. Heikin Ashi candlesticks use the opening and closing price data from the previous period and also the opening-high-low-closing price data from the current period to build a combination candlestick. The Heikin Ashi formula candlestick filters out a lot of the price action noise in an attempt to focus more on the overall trend of a chart.
Heikin Ashi candles start from the middle of the previous candle before it, instead of the level where the previous candle closed. This is a major distinguishing factor between traditional candlesticks and Heikin Ashi candlesticks on a chart.
The name comes from Heikin meaning “average” and Ashi meaning “pace” in the Japanese language. The Heikin-Ashi candles attempt to filter price action to see the average magnitude and direction of prices. Heikin Ashi candles are not the same as the normal candlesticks. Many of the common two and three candle patterns in Japanese candlesticks are not found in Heikin Ashi candlesticks as there are no gaps. This different kind of candlestick is primarily used with a focus on identifying trends, trend reversals, and in using technical analysis.
The Heikin Ashi formula:
Open = (Open of previous bar + close of previous bar)/2.
Close = (Open + high + low + close)/4.
High = The maximum value from the high, open, or close of the current period.
Low = The minimum value from the low, open, or close of the current period.
When reading Heikin Ashi candlesticks, you must look at their wick, body and color.
The top of the upper wick is the highest value on the candlestick.
The bottom of the lower wick is the lowest value on the candlestick.
The body is the difference between a time period’s open and close prices.
If the candle is green, the closing value is greater than the opening value, and is represented at the top of the body.
If the candle is red, the closing value is lower than the opening value and is represented at the bottom of the body.
The primary idea behind the creation of the Heiken Ashi type of candle chart is that it filters the noise of price action and creates less false signals by smoothing the candlestick patterns on the chart. Since the Heiken Ashi candlesticks are the result of averaging prices, these candles will have smaller shadows/wicks than a regular candlestick chart.
Also note there will be no visible gaps on Heiken Ashi charts as a result of averaging prices.
Similar to classic candlestick charts, the shadows signal the degree of volatility and the magnitude of a trend. The smaller the shadow, the stronger the trend. The same with Heiken Ashi charts. A strong candle with a very small or no shadow shows strong trending conditions. Because of averaging prices, the trend is even stronger. Heiken Ashi works best in identifying strong trends.
In a bullish uptrend, if the candles start to have larger upper shadows. This shows hesitation to go higher, rejection of higher prices, and selling pressure. The trend is losing its strength.
In a bearish downtrend, if the candles start to have larger lower shadows. This shows hesitation to go lower, rejection of lower prices, and some buying pressure. The trend is losing its momentum.
The biggest edge in using these type of candle charts is the smoothing of price trends. Unnecessary price action noise and volatility is filtered with a laser focus on the direction of the price action.
As a result, price action traders are left with the true primary directional move the market is making on a chart. There’s little room for confusion and error with Heikin Ashi candlestick charts.
How do you read a candlestick chart for beginners?
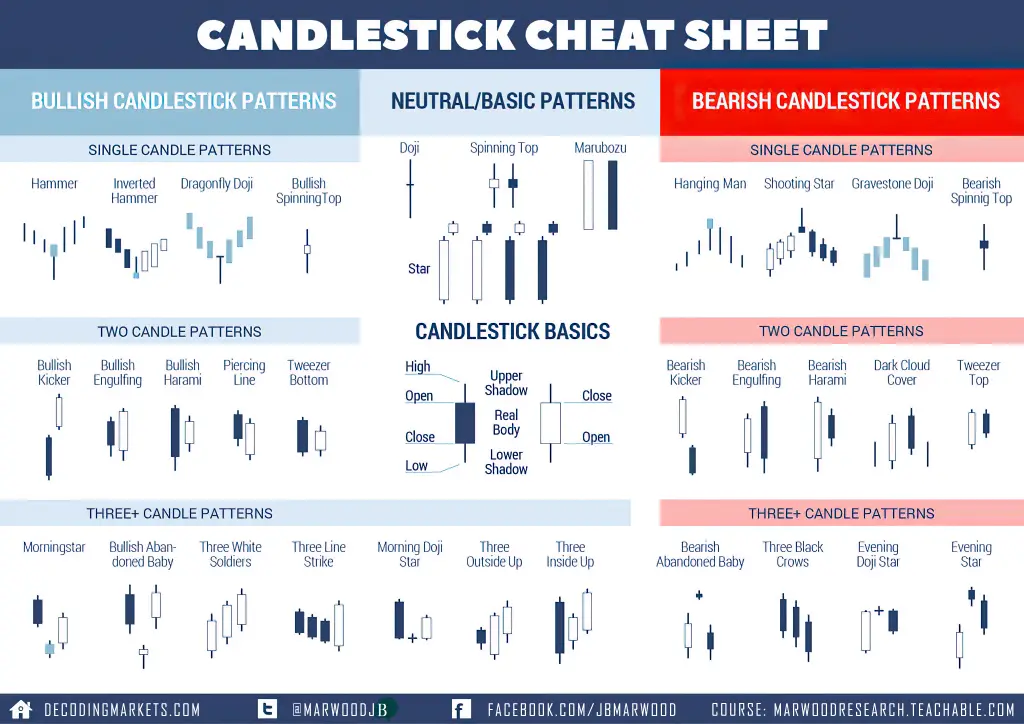
 Image courtesy of Marwood Research.
Learning to read candlesticks quickly is like learning a type of technical trading language. With time and experience a trader can see what candles are showing about the current price action. A trader can start seeing the patterns that emerge from buyers and sellers shifting the price action around key technical price levels of resistance and support on a chart. Below are bullish, bearish, and neutral candlestick chart patterns and it is important to take the signals that they give in the context of the bigger picture of the chart.
Bearish candlestick patterns will have better odds of success when they occur on a chart and have confluence with other bearish signals like overbought readings or a loss of key price support or an important moving average. The same applies with bullish candlestick patterns having better odds of success when they occur on a chart and have confluence with other bullish signals like oversold readings or breaking above a key price support or resistance area or retaking an important moving average.
Candlestick chart patterns show you the present not the future. They can be used to position traders for good odds of capturing the next direction of price movement by aligning them in the path of least resistance. Profitable trading can emerge from going with the current trend on a chart along with letting your winning trades run and cutting your losing trades short. Along with doing all this with proper position sizing and discipline.
Bullish candlestick patterns on a chart visually show buying pressure. These patterns can show the possibility of a price reversal during a downtrend or the continuation of an uptrend already in place. There can be single bullish candles or bullish candlestick patterns containing multiple candles in row.
Here are some of the most popular bullish candlestick patterns:
- Hammer
- Inverted Hammer
- Dragonfly Doji
- Bullish Spinning Top
- Bullish Kicker
- Bullish Engulfing
- Bullish Harami
- Piercing Line
- Tweezer Bottom
- Morning Star
- Bullish Abandoned Baby
- Three White Soldiers
Bearish candlestick patterns on a chart visually show selling pressure. These patterns can show the possibility of a price reversal during an uptrend or the continuation of a downtrend already in place. There can be single bearish candles or bearish candlestick patterns containing multiple candles in row.
Here are some of the most popular bearish candlestick patterns:
- Hanging Man
- Shooting Star
- Gravestone Doji
- Bearish Spinning Top
- Bearish Kicker
- Evening Star
- Bearish Engulfing
- Bearish Harami
- Dark Cloud Cover
- Tweezer Top
- Bearish Abandoned Baby
- Three Black Crows
- Evening Doji Star
- Evening Star
What do candlestick charts tell you?
Candlesticks create patterns on charts that can tell a trader the path of least resistance during a trend or identify a key high probability reversal area on a chart as the existing trend or swing in price action bends.
The best use of candlestick patterns are to define good risk/reward ratios by using their patterns to first define risk, then enter in the path of least resistance, and then cut losses short and let winners run.
Candlestick patterns are pure price action signals that can replace your own opinions and predictions with what the patterns they form tell you is happening on a chart right now.
For a deep dive into learning all the different candlestick patterns traders see on charts, you can also check out my book: The Ultimate Guide to Candlestick Chart Patterns here on Amazon or my other best selling trading books on Amazon here.
I have also created trading eCourses on my NewTraderUniversity.com website here. My educational resources can save you time in your trading journey. Learn from my 30 years of experience in the markets.