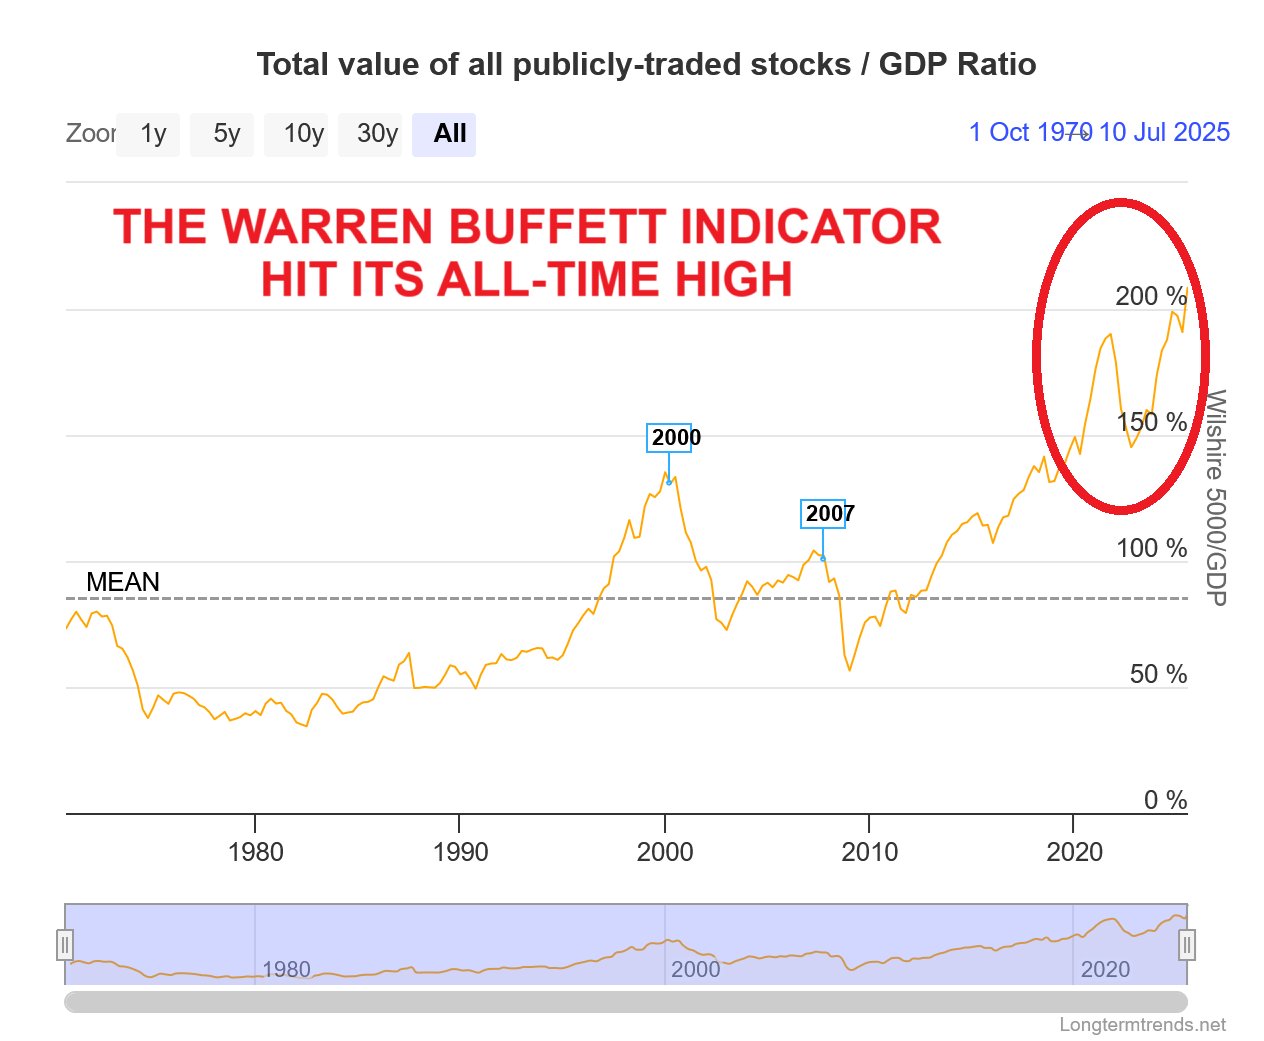
The Warren Buffett indicator has never been higher: The US stock market capitalization to GDP ratio hit a record 210% and rose 45 percentage points over the last three months. By comparison, the 2000 Dot-Com Bubble peak was ~144%.

1. The Warren Buffett Indicator: The “Best Single Measure” of Market Valuation
The Warren Buffett Indicator measures the total market capitalization of all publicly traded stocks relative to a country’s Gross Domestic Product. This simple ratio gained prominence when Warren Buffett described it as “probably the best single measure” of where stock market valuations stand at any given moment.
The calculation involves taking the combined market value of all publicly traded companies and dividing it by the nation’s annual GDP, expressed as a percentage. Buffett endorses this metric because it can capture whether stock prices have become disconnected from the underlying economic reality that should theoretically support them.
2. How This Simple Ratio Reveals Market Truth
The economic logic behind this indicator rests on a fundamental principle. Over the long term, stock market values should roughly correspond to a nation’s productive capacity and economic output. When companies collectively trade for significantly more than the economy produces, it suggests that market prices have become detached from economic fundamentals.
High readings typically indicate that stocks are expensive relative to the underlying economic activity, while lower readings may signal undervaluation. This relationship gives investors a broad perspective on whether markets are trading at reasonable levels compared to the real economy, supporting corporate earnings and growth.
3. A 45-Year Journey: From Stability to Speculation
The Warren Buffett Indicator’s journey from 1979 to 2025 tells a compelling story of evolving market dynamics. During the early period from 1979 through the 1990s, the indicator remained relatively stable, typically ranging between 30% and 60%. This era represented a time when stock valuations maintained closer alignment with traditional economic fundamentals and GDP growth.
The stability of these decades contrasts sharply with the dramatic increases that would follow, marking a clear shift in how markets began to value companies relative to economic output. This baseline period is essential for understanding how dramatically market valuations have changed over subsequent decades.
4. The Dot-Com Bubble Warning That Worked
The indicator’s credibility as a warning signal was established during the late 1990s technology boom. As internet and technology stocks soared to unprecedented levels, the Warren Buffett Indicator climbed to approximately 144% by 2000. This extreme reading preceded one of modern history’s most significant market corrections, as the dot-com bubble burst and technology stocks crashed throughout 2000 and 2001.
The indicator’s ability to identify this overvaluation before the correction occurred demonstrated its value as a broad market assessment tool. Following the bubble’s collapse, the ratio declined significantly, confirming that the extreme reading had indeed signaled dangerous overvaluation.
5. 2007’s Red Flag: Another Accurate Market Signal
The indicator provided another accurate warning signal leading to the 2008 financial crisis. In 2007, the ratio again reached elevated levels that preceded the subsequent market collapse and the Great Recession. While not as extreme as the dot-com peak, this reading once again demonstrated the indicator’s ability to identify periods when market valuations had become unsustainable relative to economic fundamentals.
The pattern of extreme readings followed by significant market corrections reinforced the metric’s reputation as a reliable gauge of broad market overvaluation. The 2007-2008 experience further validated Buffett’s assessment of this ratio as a crucial market measurement tool.
6. Breaking Records: 210% and Climbing Fast
Today’s Warren Buffett Indicator reading has reached an unprecedented 210%, substantially shattering all previous records. This current level of 210% exceeds the all-time high of 144% reached during the dot-com bubble by 46 percentage points. Never before in the indicator’s history has the ratio reached such extreme levels, placing current market conditions in uncharted territory.
The magnitude of this reading suggests that stock market valuations have become more divorced from economic fundamentals than during any previous period, including the most notorious speculative bubbles of recent decades.
7. 45 Points in 3 Months: When Markets Lose Touch with Reality
The indicator’s rapid acceleration over just three months stands out, with the ratio climbing 45 percentage points in this brief timeframe. Such dramatic increases typically signal speculative activity rather than gradual appreciation based on improving economic fundamentals or corporate earnings growth.
This pace of increase suggests that market prices have become increasingly detached from the underlying economic reality that should theoretically support stock valuations. The speed of this rise distinguishes it from more gradual market appreciations that might reflect genuine economic improvement or corporate performance enhancement.
8. Why This Makes the Dot-Com Bubble Look Tame
The current 210% reading makes the infamous dot-com bubble appear modest by comparison. At 46% higher than the previous record of 144%, today’s market valuation represents a level of disconnection from economic fundamentals that exceeds even the most notorious speculative period in recent memory.
This comparison provides a crucial perspective on the current situation’s unprecedented nature. The dot-com era, widely regarded as one of history’s most extreme examples of market speculation, has been significantly surpassed by current valuation levels. This development places the present market environment in an entirely different category.
9. What Changed? Technology, Globalization, and Modern Markets
Several structural changes in the global economy may help explain why the indicator has reached such extreme levels. The rise of asset-light technology companies has fundamentally altered how businesses create value, potentially justifying higher market capitalizations relative to traditional GDP measures.
Additionally, many large US corporations generate substantial revenue from international operations, meaning their market values may reflect global rather than purely domestic economic activity. Changes in monetary policy over recent decades, including extended periods of low interest rates, have also influenced how investors value future cash flows and growth prospects.
10. The Concentration Problem: When a Few Giants Skew Everything
The extraordinary concentration of market value in a handful of mega-capitalization technology companies significantly influences the overall ratio. When a few companies command enormous market capitalizations, their collective impact on the total market-to-GDP calculation becomes substantial.
This concentration effect means that the valuations of these dominant companies can drive the entire indicator to extreme levels, even if the broader market remains more reasonably valued. The mathematical impact of this concentration creates a situation where traditional valuation metrics may not fully capture the nuanced reality of modern market structure.
11. History’s Track Record: What Happened After Previous Peaks
Historical evidence demonstrates a clear pattern of significant market corrections following extreme Warren Buffett Indicator readings. The 2000 and 2007 peaks were followed by substantial bear markets that brought valuations back toward more sustainable levels.
The post-2000 technology crash and the 2008 financial crisis confirmed the indicator’s ability to identify unsustainable market conditions before major corrections occurred. While past performance can’t predict future results, this historical track record establishes the indicator’s credibility as a broad market assessment tool and highlights the significance of extreme readings.
12. The Timing Dilemma: Being Right vs. Being Early
While the Warren Buffett Indicator has proven effective at identifying overvalued market conditions, it provides limited guidance on the timing of potential corrections. Markets can remain elevated for extended periods, particularly in environments characterized by accommodative monetary policy or strong investor sentiment.
The indicator’s strength lies in identifying when valuations have become extreme relative to economic fundamentals, rather than predicting exactly when market corrections might occur. This limitation means that while the metric can signal caution, it should not be used as a short-term market timing tool.
13. Uncharted Territory: Are We in the Biggest Bubble Ever?
The current 210% reading places markets in uncharted territory, raising fundamental questions about whether we are witnessing the largest speculative bubble in modern financial history or structural economic changes have created a new normal for market valuations.
The indicator now stands at approximately three times its long-term historical average, representing a deviation level with no historical precedent. This extreme reading forces consideration of two possibilities: either current conditions represent the most significant market bubble ever recorded, or fundamental economic changes require a complete recalibration of what constitutes normal valuation levels.
Conclusion
The Warren Buffett Indicator’s record-breaking 210% reading delivers an unmistakable message about current market conditions. This unprecedented level, far exceeding even the dot-com bubble’s peak, demands serious attention from investors, policymakers, and market participants.
While structural changes in the modern economy may provide some justification for higher baseline valuations, the extreme nature of the current reading suggests that caution is warranted.
The indicator’s historical track record of preceding major market corrections, combined with its unprecedented level, creates a situation that deserves careful monitoring and thoughtful consideration in any investment strategy or market analysis.
