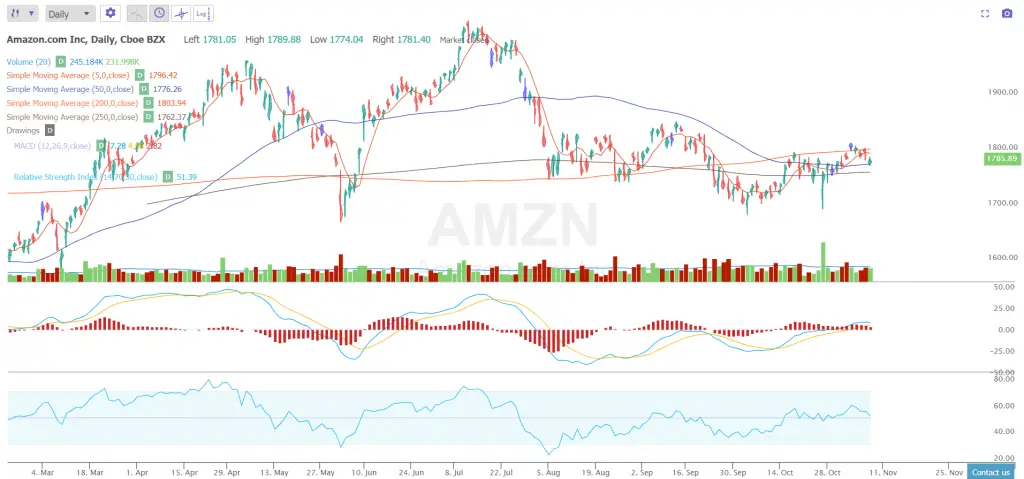
Current Amazon Stock Price Trend
10 facts about the Amazon chart: Current resistance is the 200 day simple moving average. Amazon price failed at the 200 day SMA on the last three attempts to break out. The 250 day simple moving average has held as support since price back over it on October 14th. The dynamics of short term resistance […]
Current Amazon Stock Price Trend Read More »
