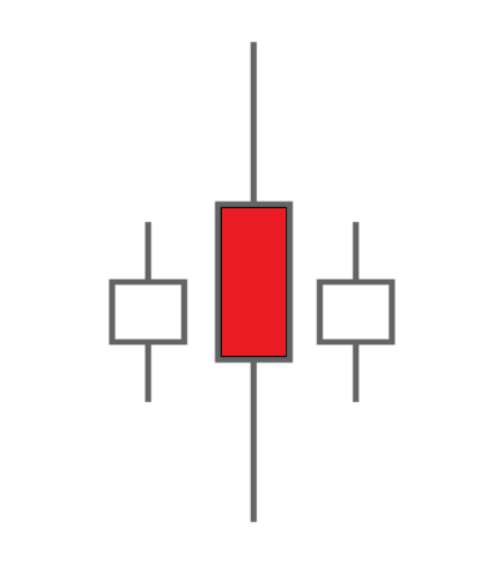
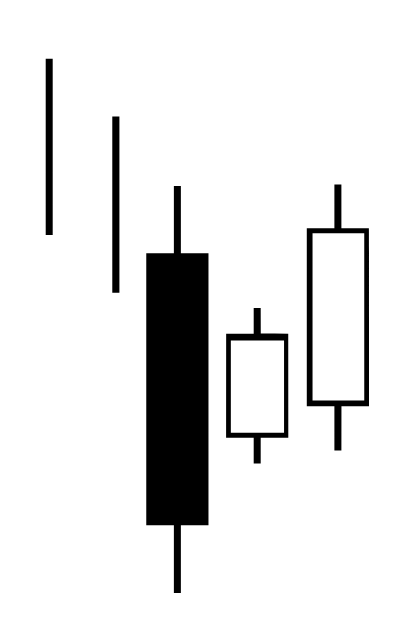
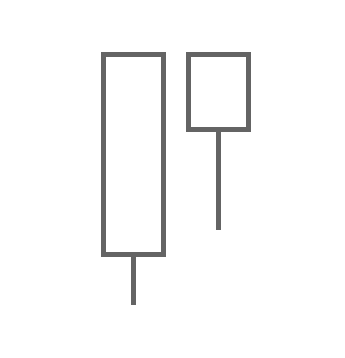
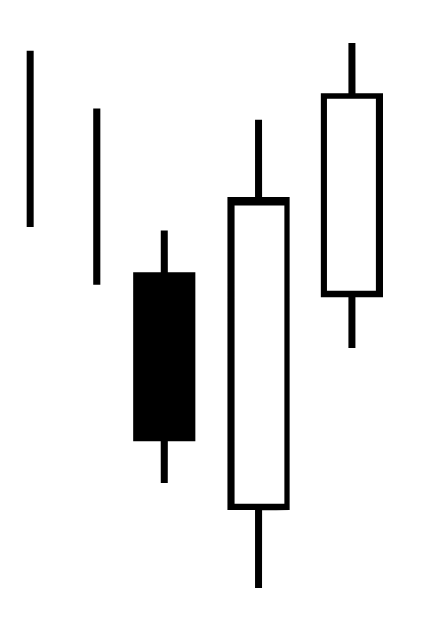
The high wave spinning top candlestick pattern consists of a candle with both a large body and also long wicks above and below sandwiched between small candles both before and after it forms... Read more
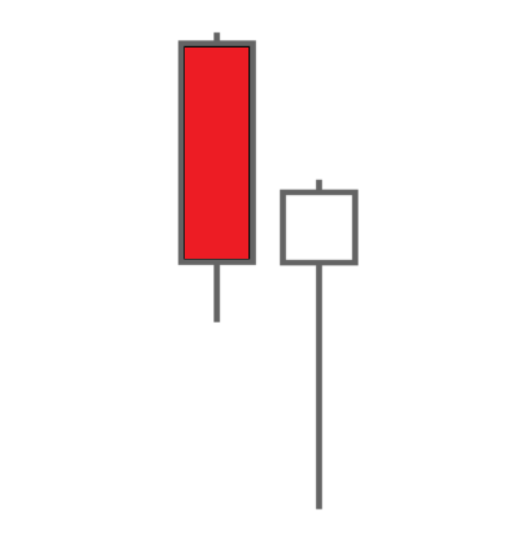
The Judas candle pattern consists of a large red bearish candle followed by a long bullish white reversal candle with a long lower tail which is approximately equal to the bearish candle in... Read more
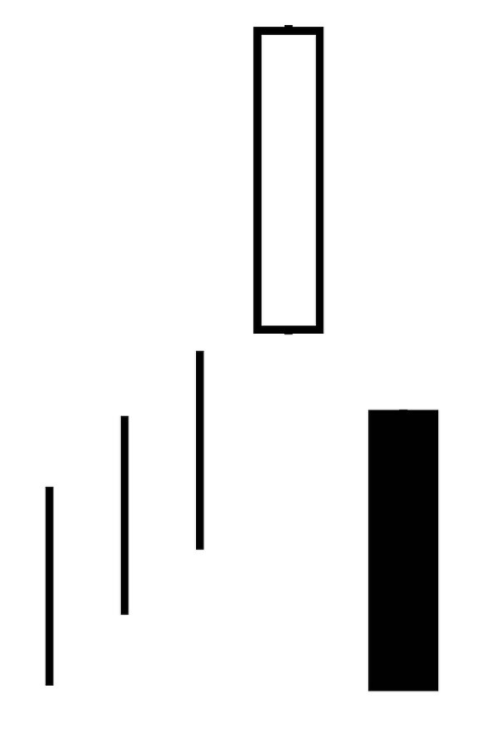
The bullish three-line strike candlestick pattern is a dip buy signal that occurs when a large bearish candle follows three smaller bullish candles during an uptrend in price. It is a four-c... Read more
After a decade trading I settled on using candlesticks on my charts. I like how candles visually represent price action and quickly show the contrast of the open, close and daily range. I us... Read more
The bearish kicker is a two-candle pattern that starts with a large bullish candlestick higher (white or green depending on the charting platform) then a second large bearish candle that gap... Read more
The three inside up candlestick pattern is a bullish momentum signal on a chart. It is formed when a large bearish candle is followed by a smaller bullish candle that has its range inside th... Read more
A bearish harami candlestick pattern is created by two candles, first a large bullish candle then next a small bearish candle. The full trading range of the opening and closing prices of the... Read more
The tweezer top candlestick pattern is created by two or more candles with matching highs in price. A tweezer top happens when two candlesticks form back to back or near each other with exac... Read more
The bullish three outside up candlestick pattern is a three three-candle reversal signal that can appear on charts during downtrends in price. It is formed by a bearish candlestick followed... Read more
The doji star is a neutral signal that occurs when a single candle has opening and closing prices that are close to the same. A single doji star candle alone means that buyers and sellers re... Read more