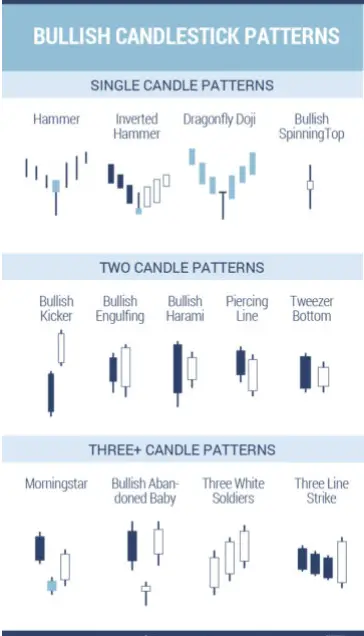
Bullish Candlestick Patterns
Bullish candlestick patterns on a chart visually show buying pressure. These patterns can show the possibility of a price reversal during a downtrend or the continuation of an uptrend already in place. There can be single bullish candles or bullish candlestick patterns containing multiple candles in row. Here are some of the most popular bullish […]
Bullish Candlestick Patterns Read More »

