Three Line Strike Candlestick Pattern
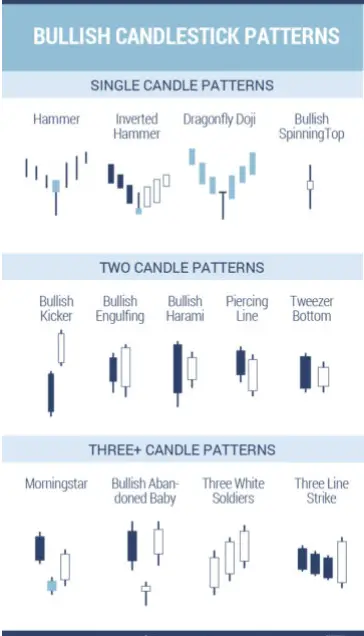
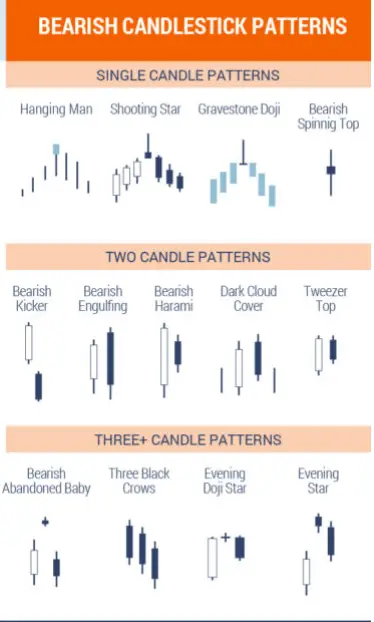
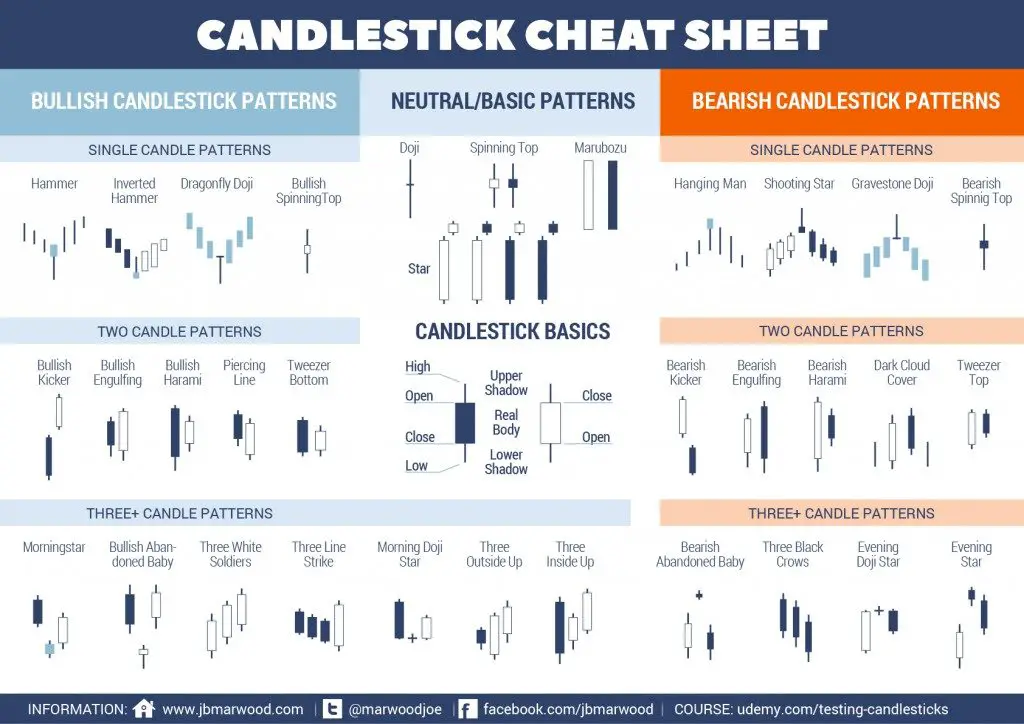
The bullish three-line strike candlestick pattern is a dip buy signal that occurs when a large bearish candle follows three smaller bullish candles during an uptrend in price. It is a four-candle pattern where each of the three bullish candles has a higher high and higher low and closes near the price range high each […]
Three Line Strike Candlestick Pattern Read More »


