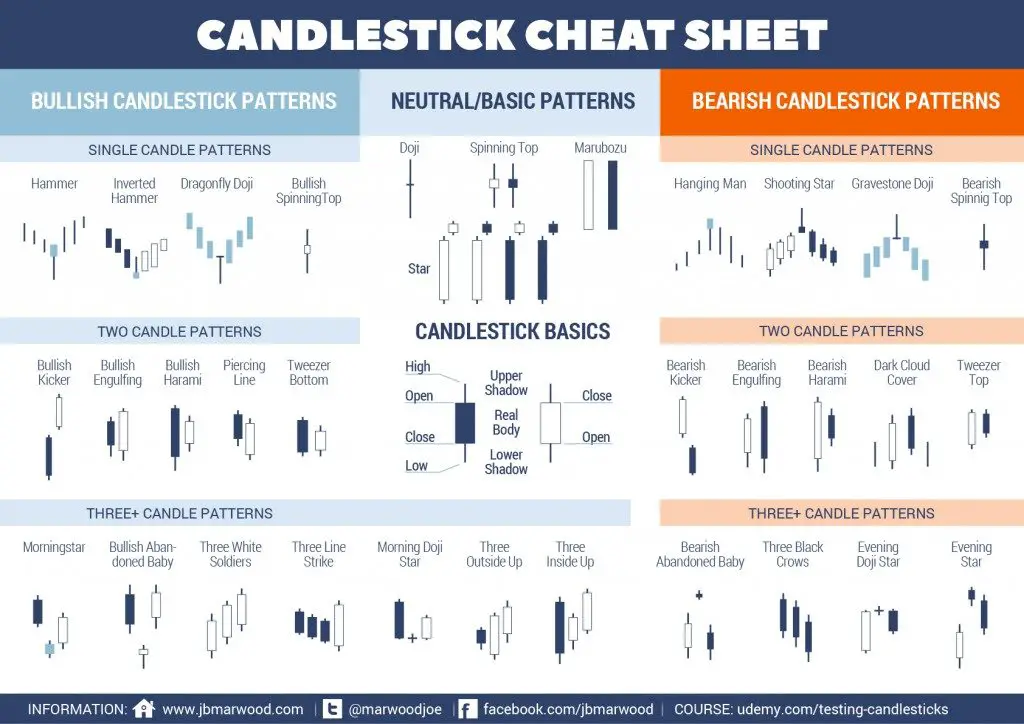
candlestick chart

long legged doji

Long Legged Doji Candlestick Patterns Explained

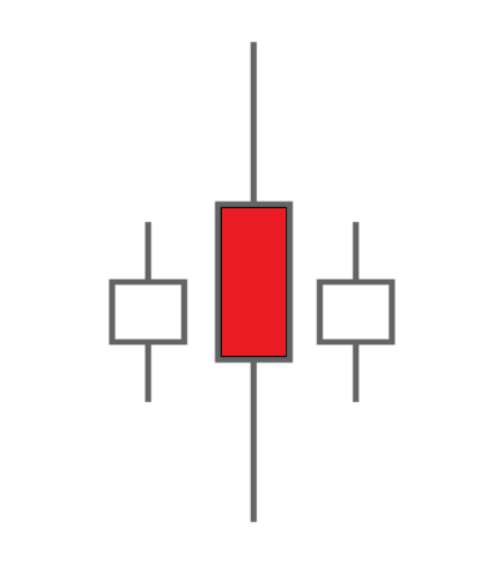
What is a long-legged doji candlestick pattern? The long-legged doji candlestick pattern has both long upper and lower shadows (wicks) and generally has a closing price near where it opened in the time frame of the candle. The long-legged doji candlestick can signal extreme indecision in the current market with a large trading range but …

Long Legged Doji Candlestick Patterns Explained Read More »

how to read candlestick charts

Types of Candlesticks and Their Meaning

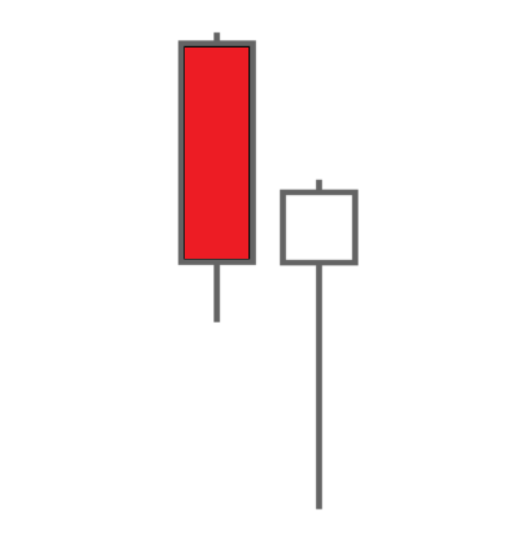
A candlestick chart is a type of visual representation of price action used in technical trading to show past and current price action in specified timeframes.   Most candlestick charts will reflect a higher close than the open as represented by either a green or white candle with the opening price as the bottom of the …

Types of Candlesticks and Their Meaning Read More »