candlestick charts

Understanding Candlestick Charts for Beginners

Understanding Candlestick Charts for Beginners

Candlestick charts, originating from Japan over 300 years ago, have become an essential tool for traders worldwide. They provide valuable insights into market sentiment and potential price movements. This blog post delves into the basics of candlestick charts, common patterns, their analysis in context, and practical tips for trading using these charts. By the end, […]

Understanding Candlestick Charts for Beginners Read More »

Engulfing Patterns

Engulfing Patterns

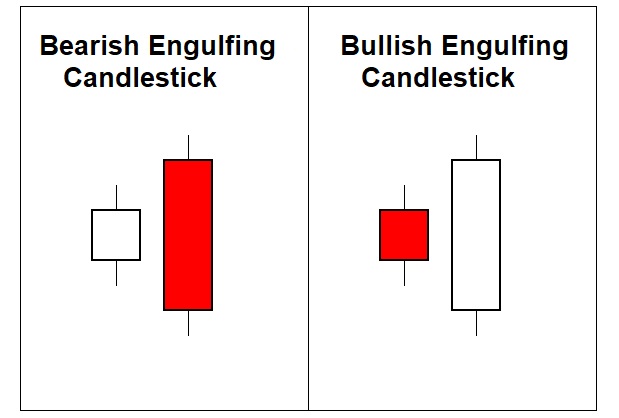
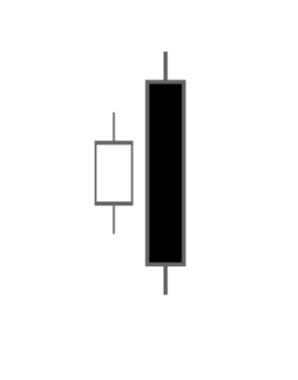
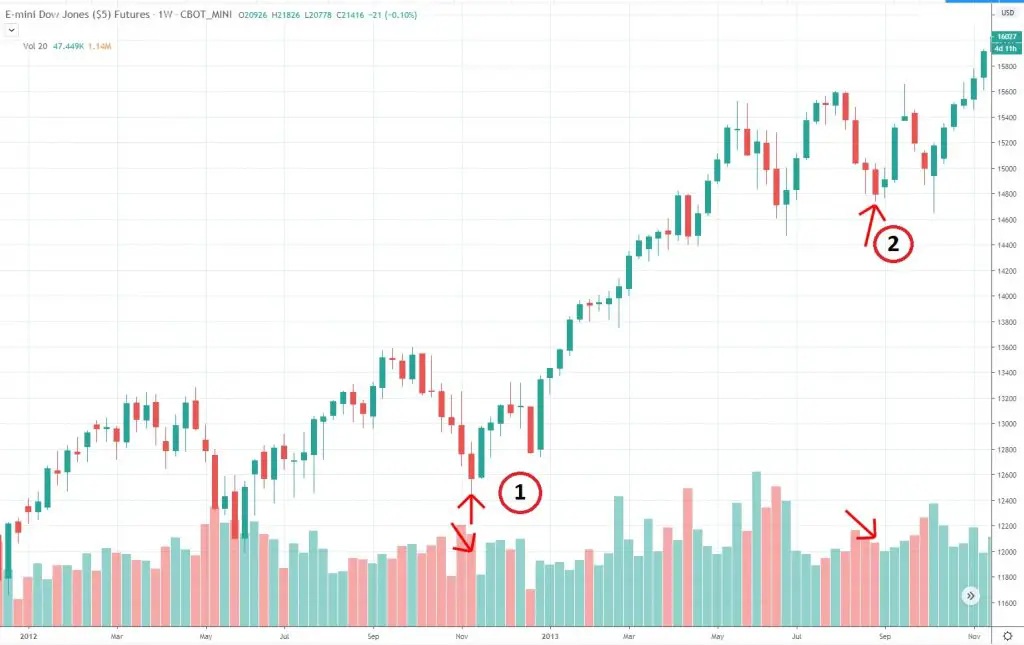
An engulfing pattern forms on a candlestick chart when a small candle is followed by a larger candle that reaches outside the previous candle’s trading range. The new larger candle will make both a higher high and lower low than the previous smaller candlestick before it on the chart. Engulfing candlestick patterns can be bullish

Engulfing Patterns Read More »

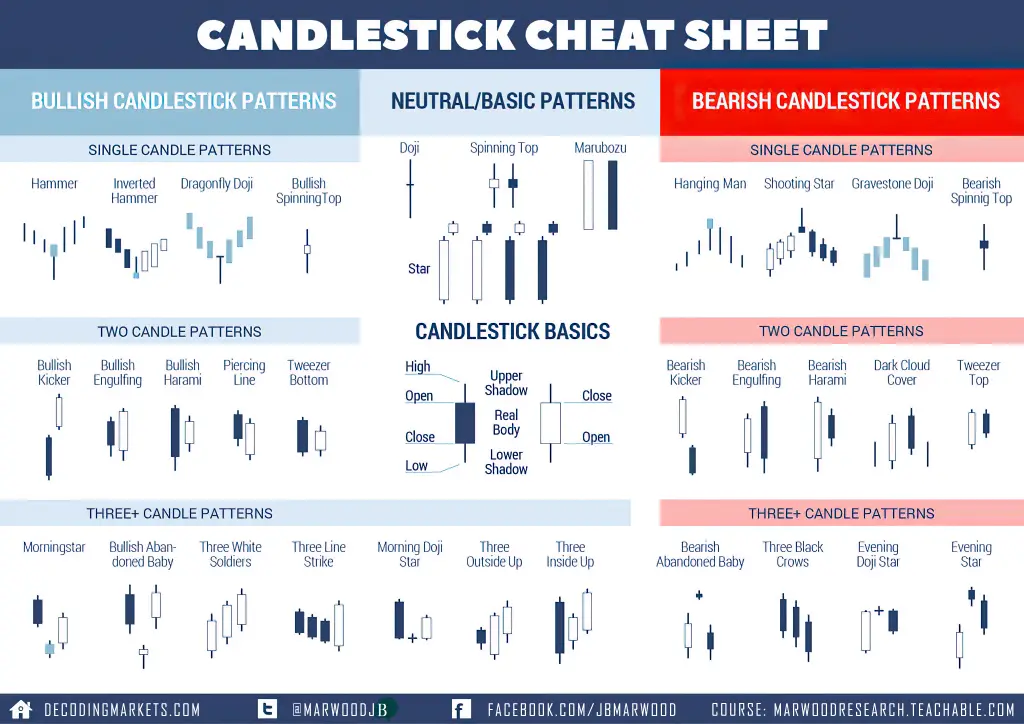
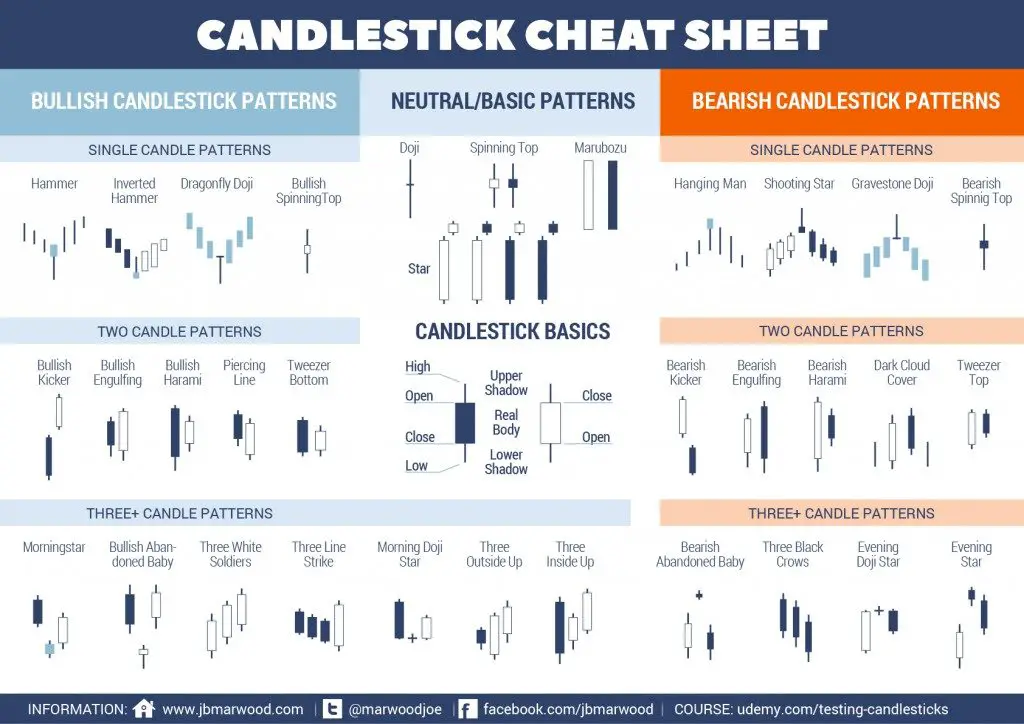
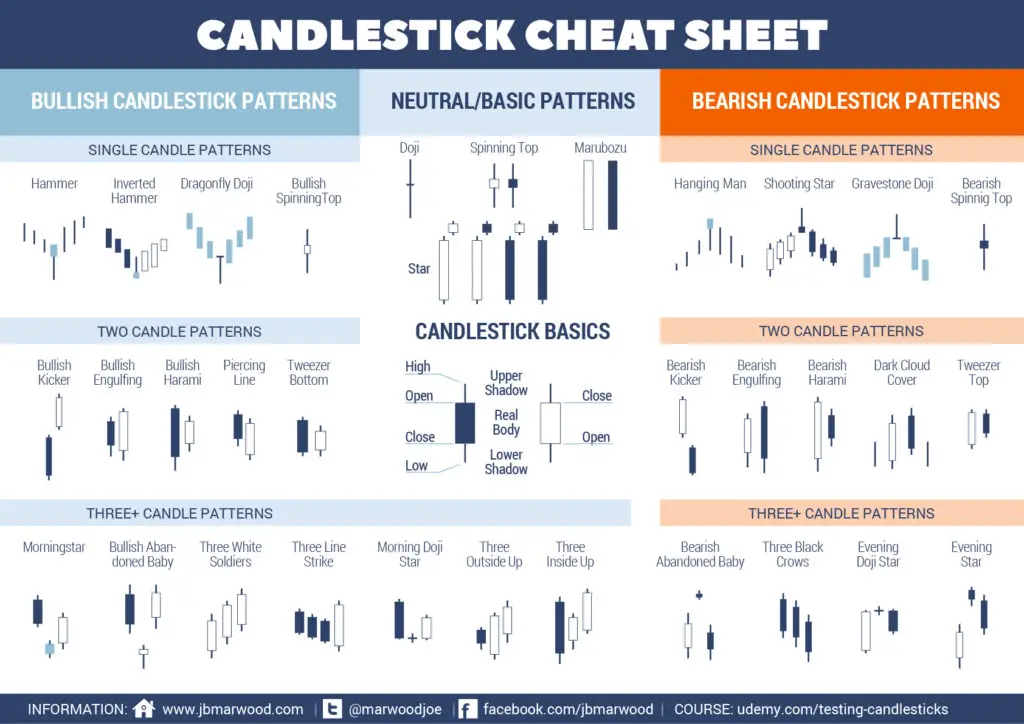
Candlestick Charts Cheat Sheet

Candlestick Charts: The ULTIMATE beginners guide to reading a candlestick chart

Candlesticks are a type of chart setting available on trading platforms that creates a visually representation of price action on a time period. A candlestick shows a contrast between the opening and closing prices along with any range outside the open or close. They are colored to show bullish or bearish action. The three primary

Candlestick Charts: The ULTIMATE beginners guide to reading a candlestick chart Read More »

how to read candlestick charts

Types of Candlesticks and Their Meaning

A candlestick chart is a type of visual representation of price action used in technical trading to show past and current price action in specified timeframes.   Most candlestick charts will reflect a higher close than the open as represented by either a green or white candle with the opening price as the bottom of the

Types of Candlesticks and Their Meaning Read More »