How to Create a Candlestick Chart on Excel
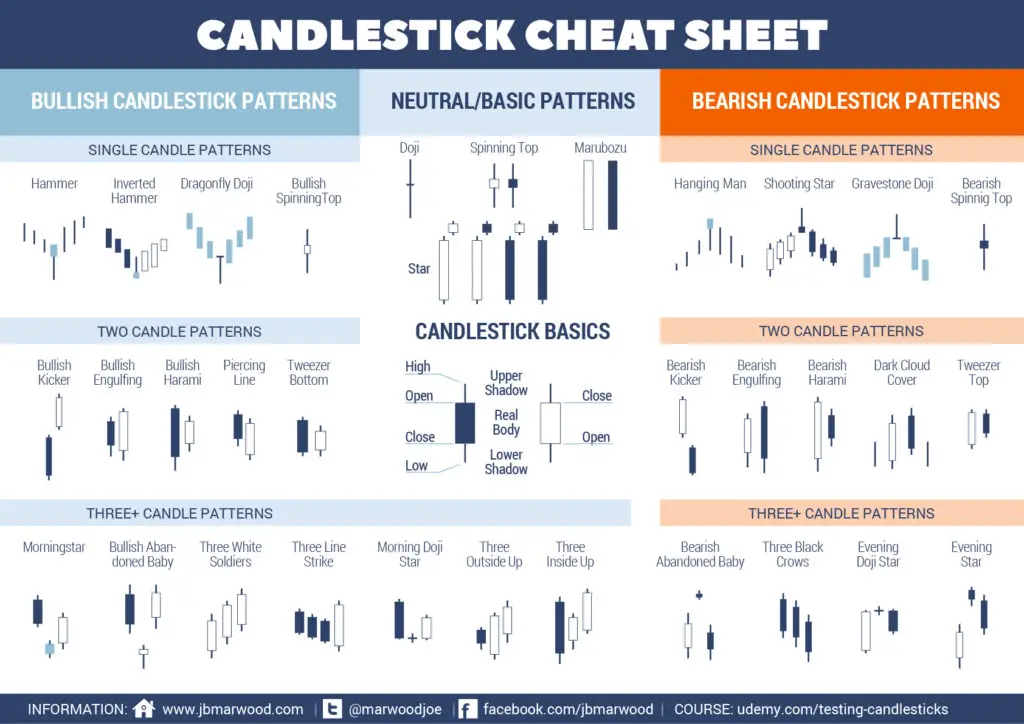
This is a Guest Post by @BullDudeC of BullDude.com. A Japanese candlestick chart is a type of visual price display of a financial instrument. Usually charts are displayed as a line that combines the closing prices of the various trading sessions. The disadvantage of this type of display is that only the closing price […]
How to Create a Candlestick Chart on Excel Read More »
