The 5 Best Trading Patterns You’ve Never Heard Of
This is a guest post by Leo Smigel the Founder of AnalyzingAlpha.com. If you’re like most traders, you’re always on…
Helping Traders Thrive
This is a guest post by Leo Smigel the Founder of AnalyzingAlpha.com. If you’re like most traders, you’re always on…
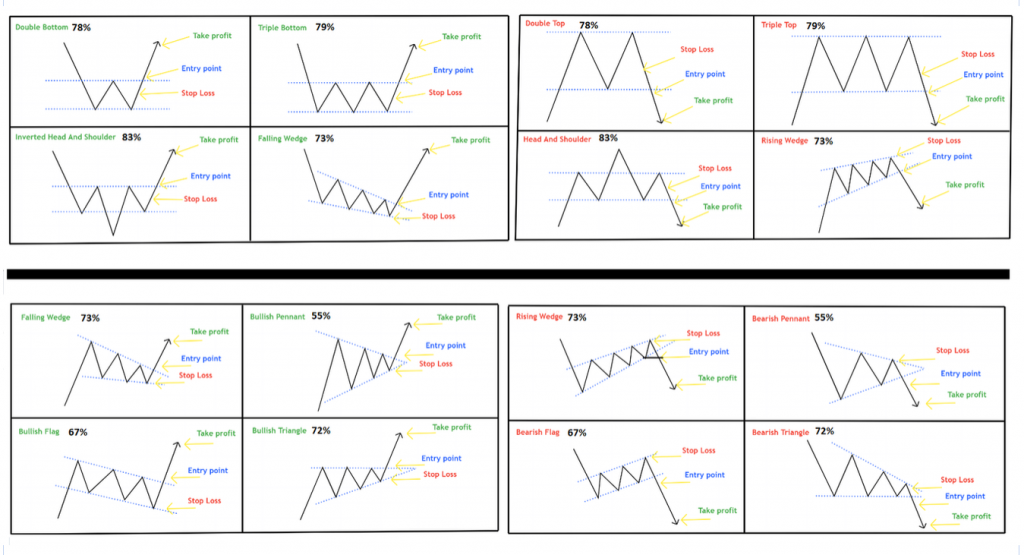
A Rising Wedge is a bearish chart pattern that forms during a downtrend in price action that has upward trend…
How many types of chart patterns are there? There are three main types of chart patterns which are used in technical…
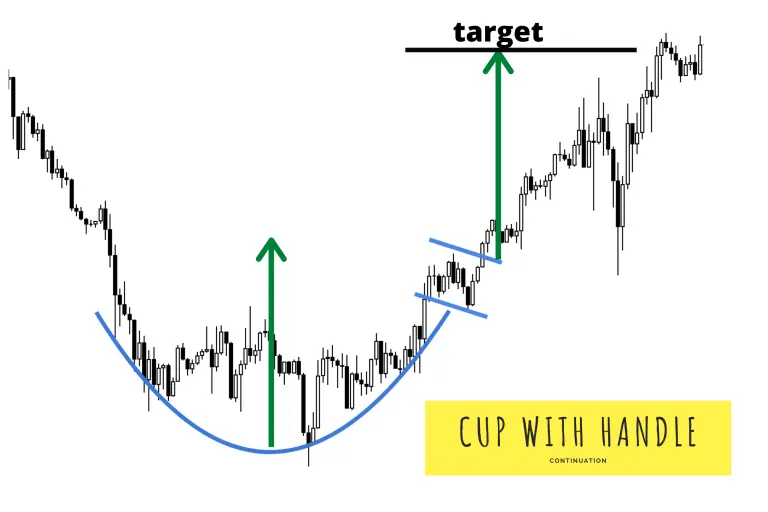
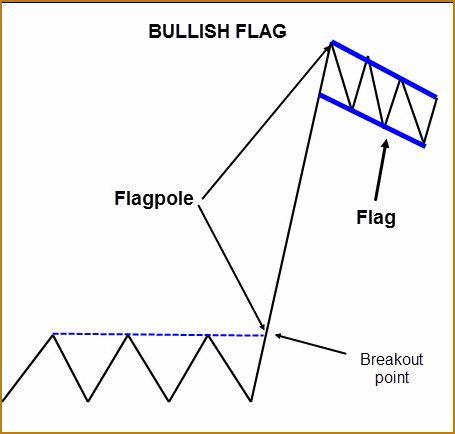
Chart patterns are visual representations of price action. Chart patterns can show trading ranges, swings, trends, and reversals in price…
The rounding top chart pattern is a bearish reversal that occurs after an uptrend on a chart. The rounded top…
In technical analysis the triple bottom pattern can be a possible signal for a reversal higher in price. This pattern…
Cryptocurrency Chart Patterns Cryptocurrency price action creates chart patterns like any other market. The patterns formed are simply visual representations…
Guide to Chart Patterns Price action creates chart patterns in the financial markets through the buying and selling of positions by traders…
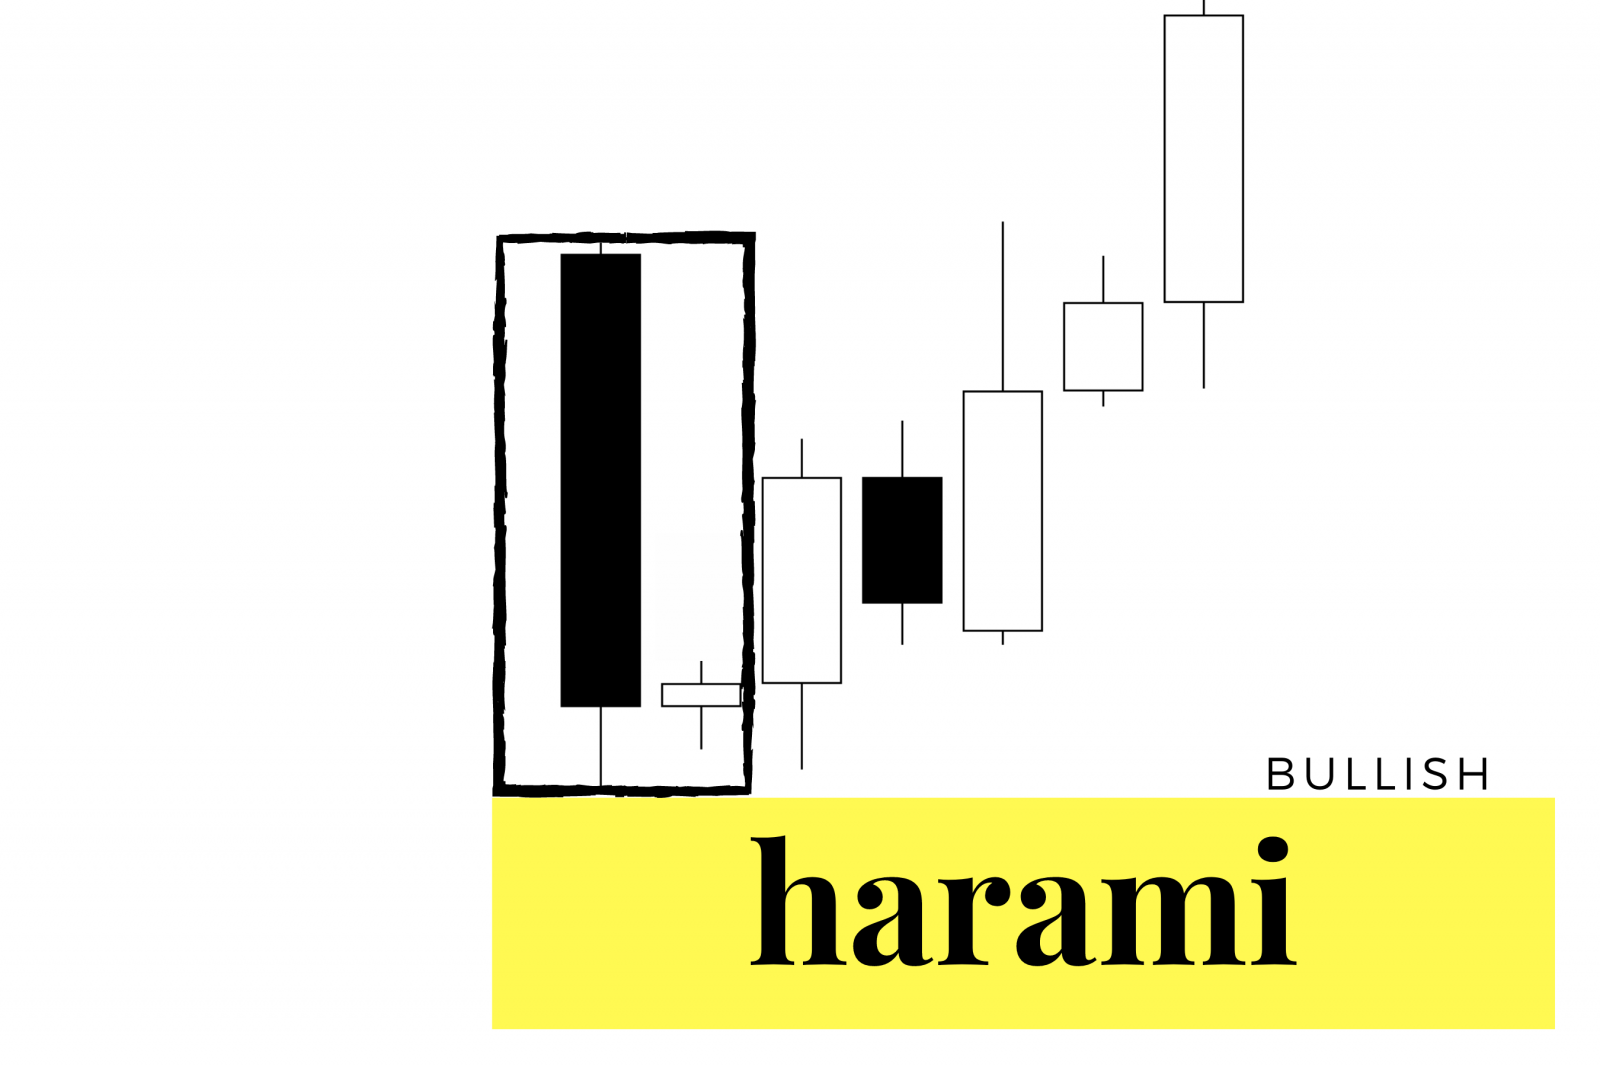
A candlestick is a type of chart used in trading as a visual representation of past and current price action…
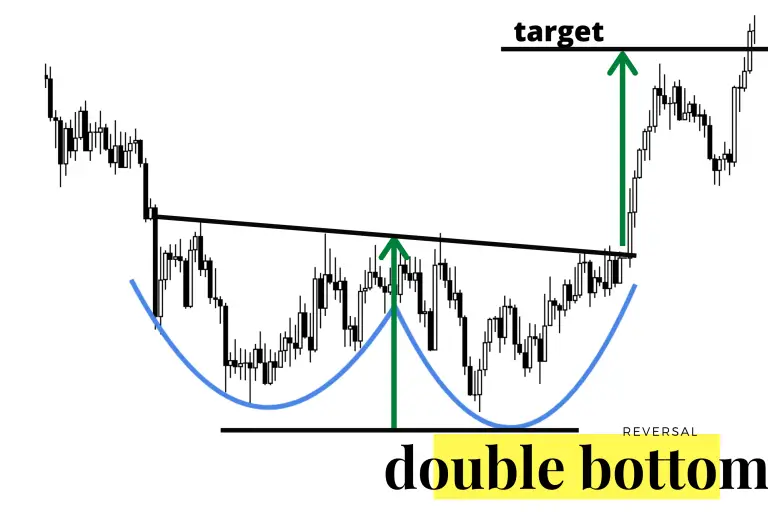
A W pattern is a double bottom chart pattern that has tall sides with a strong trend before and after…