Chart patterns

Rounding Top

Rounding Top

The rounding top chart pattern is a bearish reversal that occurs after an uptrend on a chart. The rounded top is formed after an uptrend in price action stalls out near a peak and goes sideways into a range before slowly going lower to create lower highs and lower lows. The pattern forms a downward […]
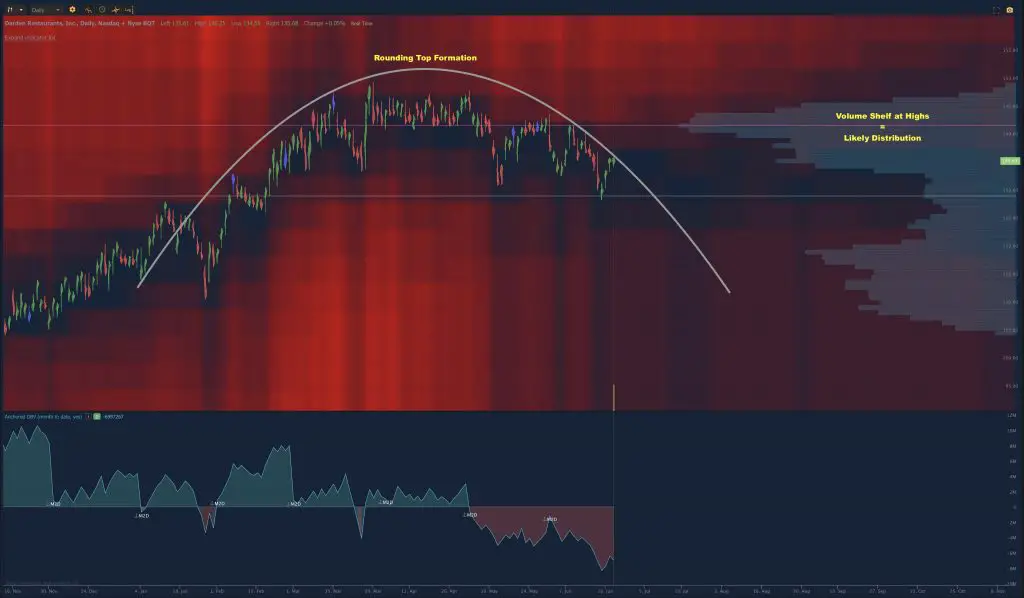
Rounding Top Read More »

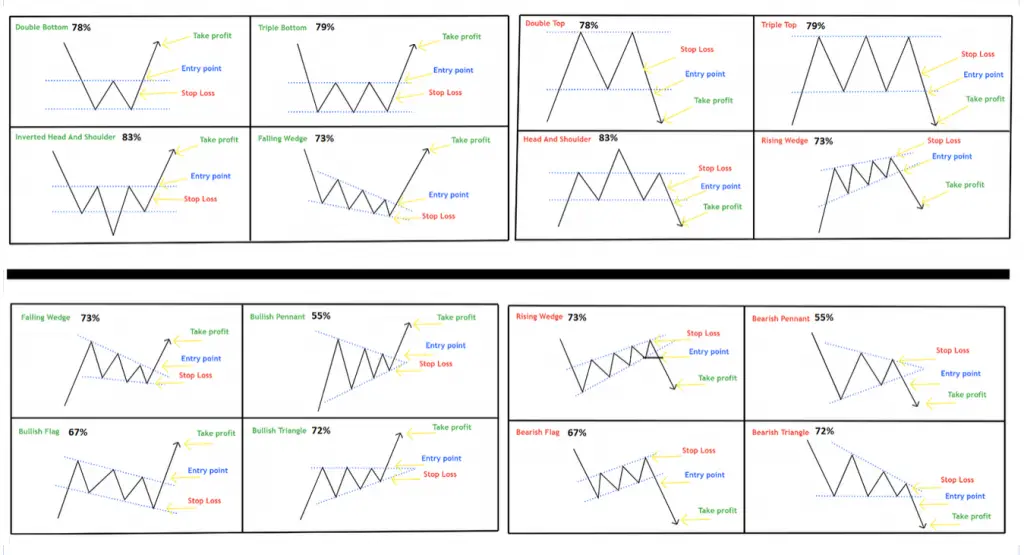
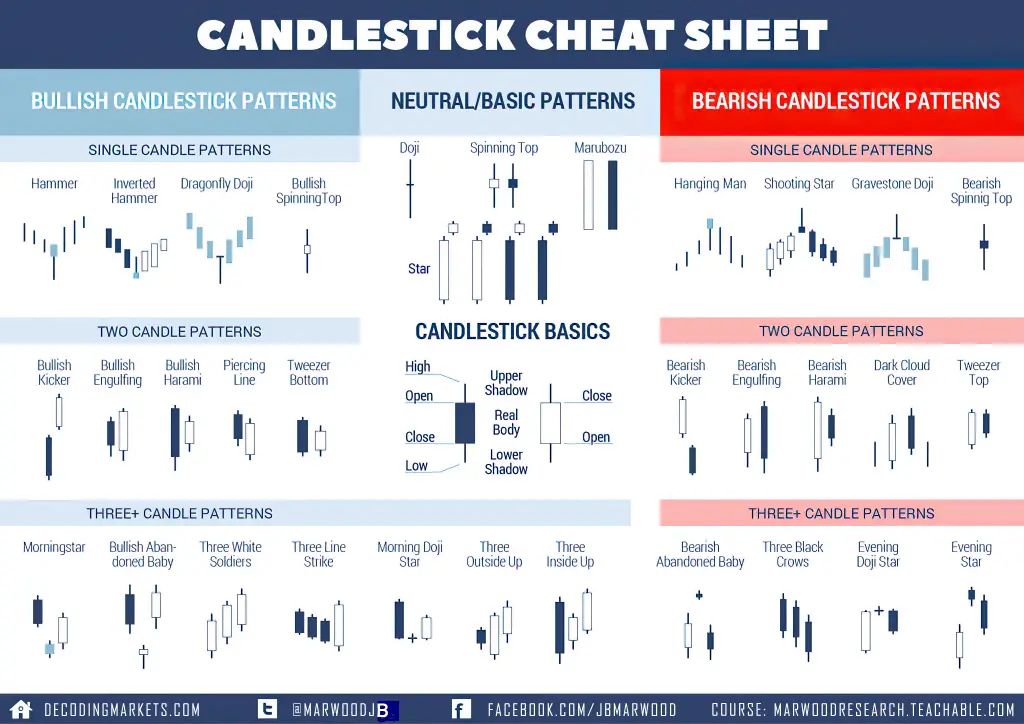
Chart patterns cheat sheet

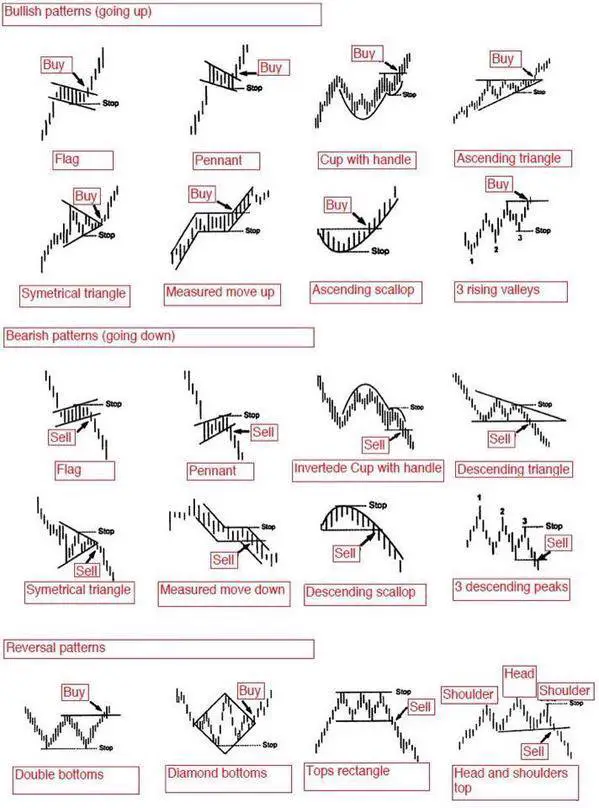
Visual Index of Chart Patterns

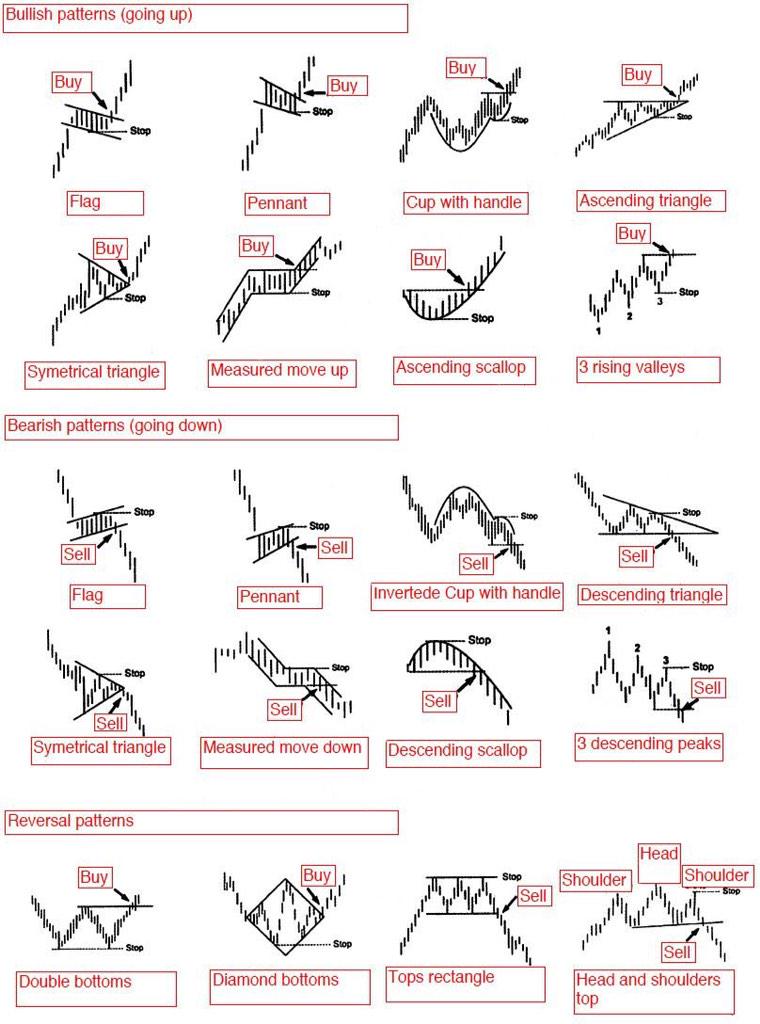
Here is a visual index of all the most popular chart patterns used by traders to visually trade price action in the path of least resistance. The most misunderstood concept of using chart patterns to trade is that the edge doesn’t come from their ability to predict the future or their win rate. The edge

Visual Index of Chart Patterns Read More »

Trading Was Hard Until I Understood These 3 Concepts

The Complete Guide to Technical Analysis Price Patterns

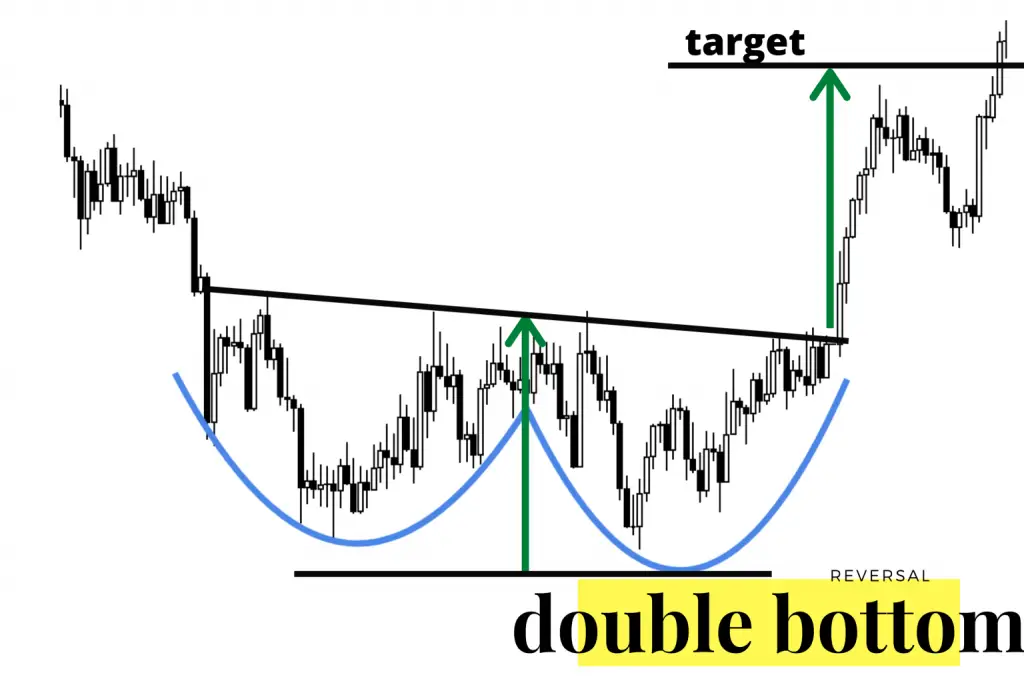
Website Articles Table of Contents with Links: What is Technical Analysis? Does Technical Analysis Work? What causes a Chart Pattern? How to Draw Trendlines on a Chart Bullish Pennant pattern Bullish Flag pattern Bearish Flag pattern Rising Wedge pattern Falling Wedge pattern Triangles pattern Symmetric Triangles pattern Ascending Triangles pattern Descending Triangles pattern Cup and

The Complete Guide to Technical Analysis Price Patterns Read More »