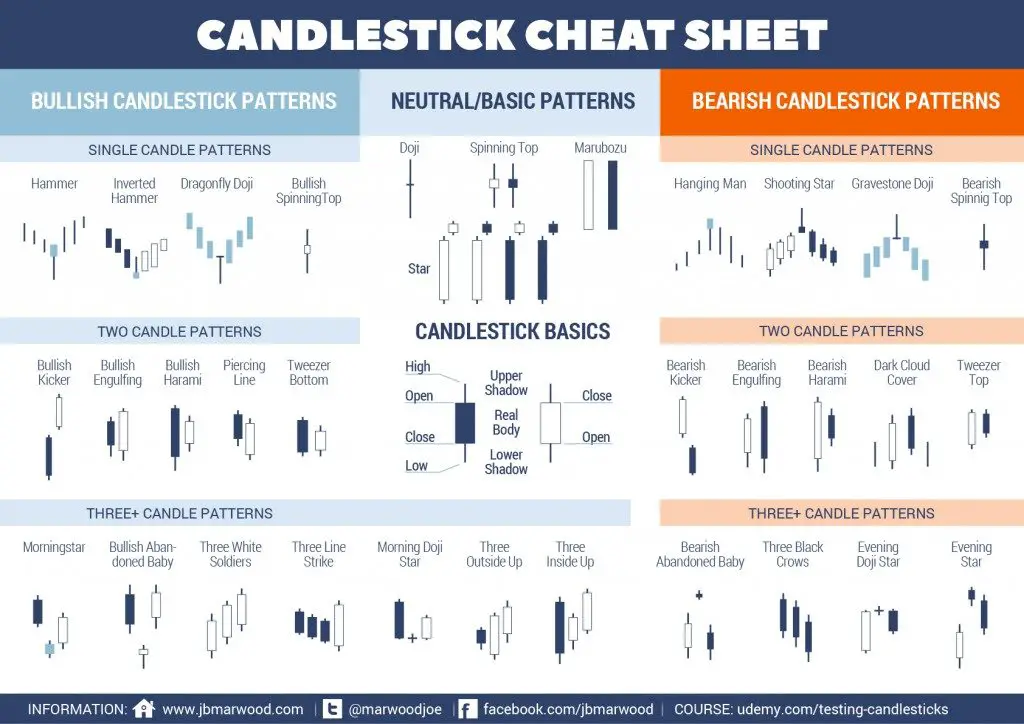
Types of Candlesticks and Their Meaning
A candlestick chart is a type of visual representation of price action used in technical trading to show past and current price action in specified timeframes. Most candlestick charts will reflect a higher close than the open as represented by either a green or white candle with the opening price as the bottom of the […]
Types of Candlesticks and Their Meaning Read More »

