What is RSI in Stocks?
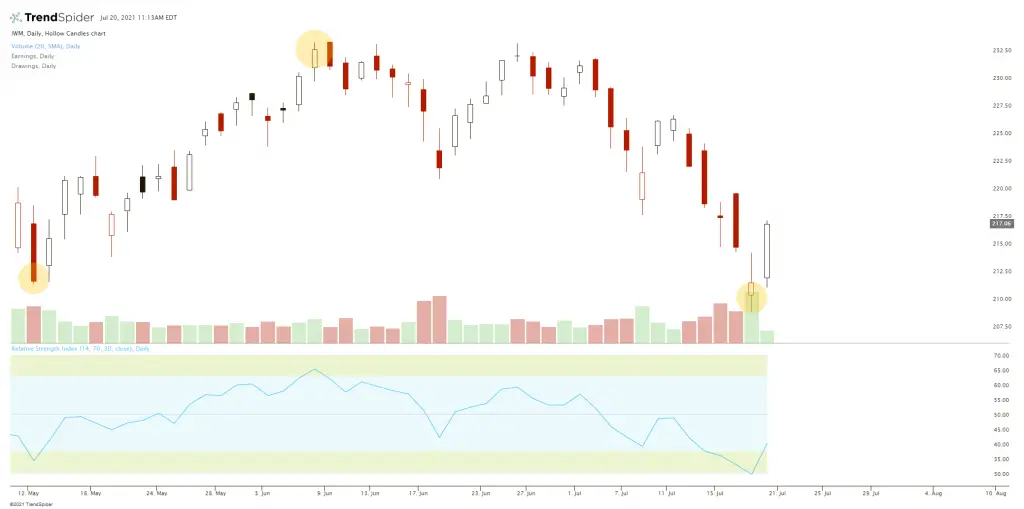
The RSI indicator buy and sell signals are based on oversold and overbought conditions on a stock chart. The RSI is a measurement of price moving too far and too…
Helping Traders Thrive
The RSI indicator buy and sell signals are based on oversold and overbought conditions on a stock chart. The RSI is a measurement of price moving too far and too…
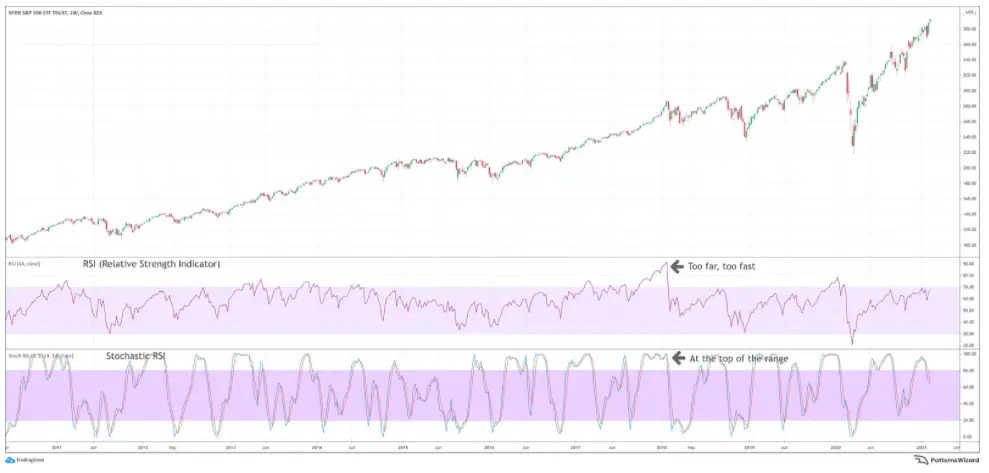
The following is a guest post from @PatternsWizard of PatternsWizard.com What is the Relative Strength Index (RSI)? RSI is a technical indicator used in technical analysis that helps to gauge the…
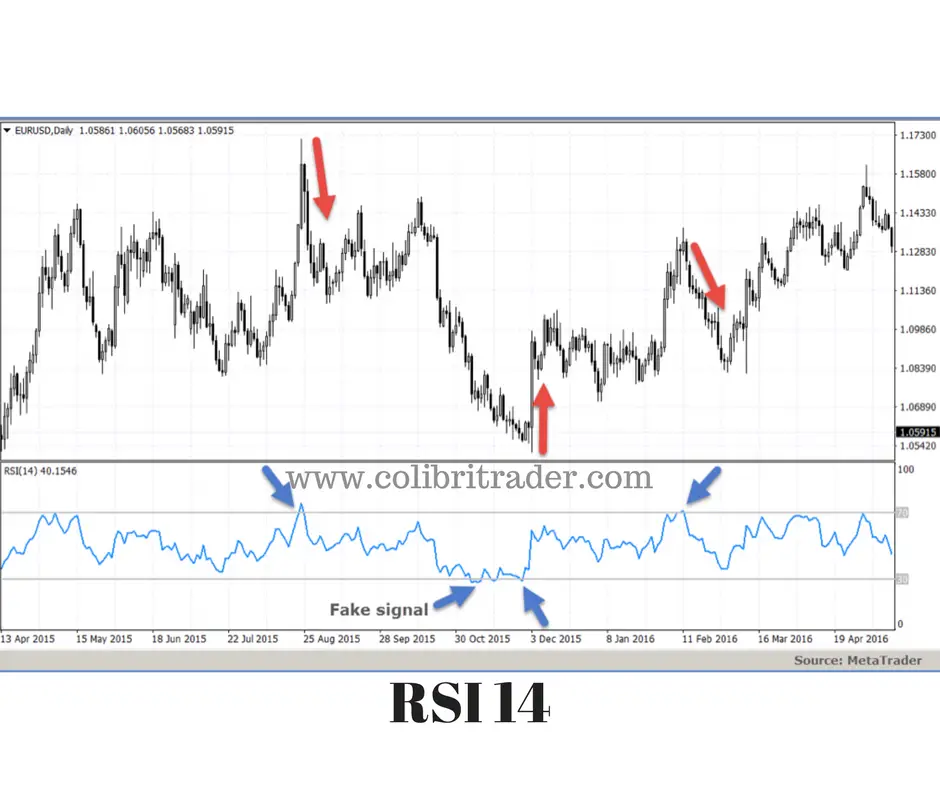
Oversold is a technical analysis term for when the price of a company’s stock is considered too low from a technical view point. Value investors can also measure a stock…
Simple trend trading signals have the best chance of having an edge as they create big wins and small losses by their structure of letting winners run and cutting losers…
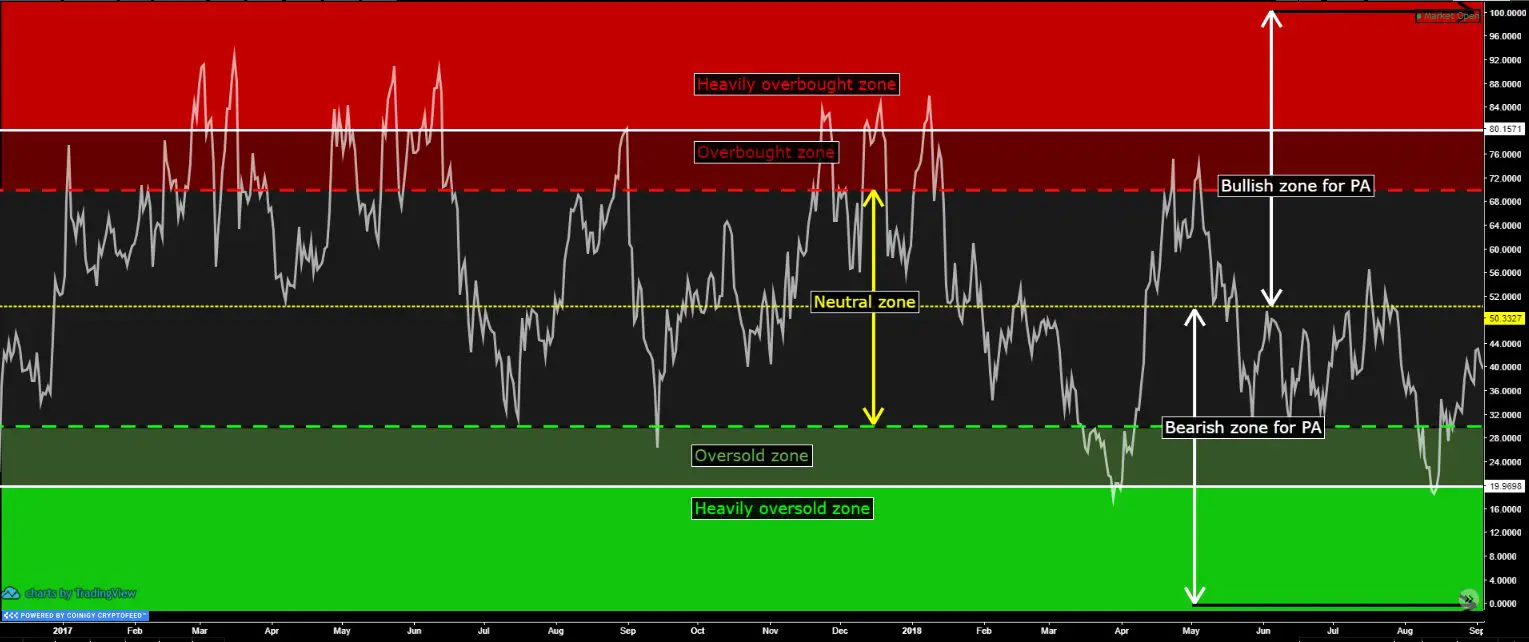
The RSI (Relative Strength Indicator) is a is a momentum oscillator that measures the speed and change of price movements. The RSI moves in a bounded range between zero and 100.…