Stock Chart Patterns 101
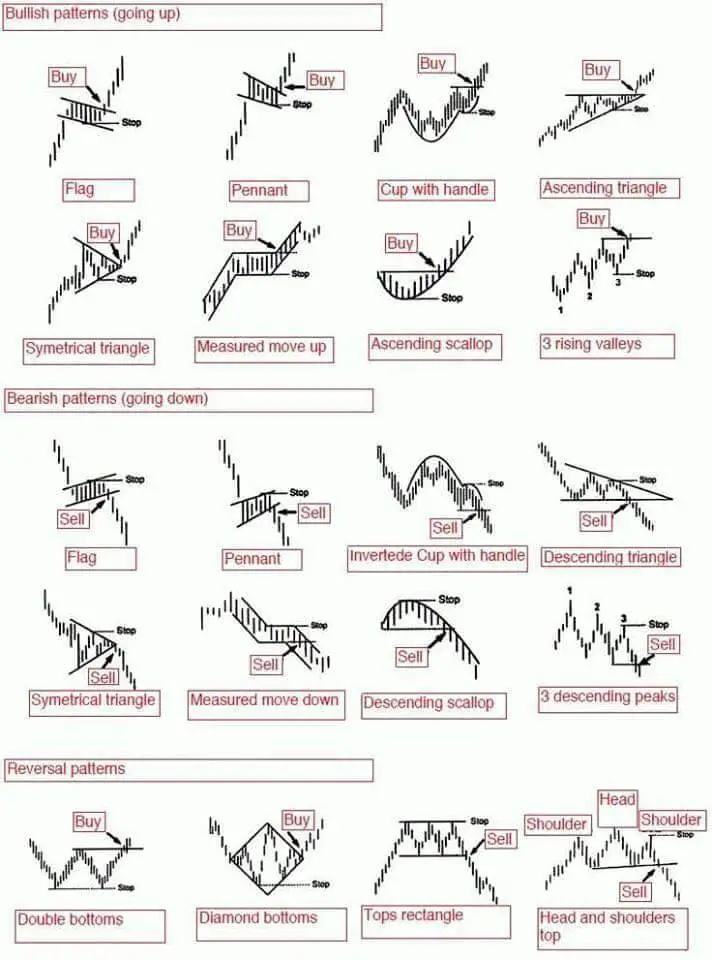
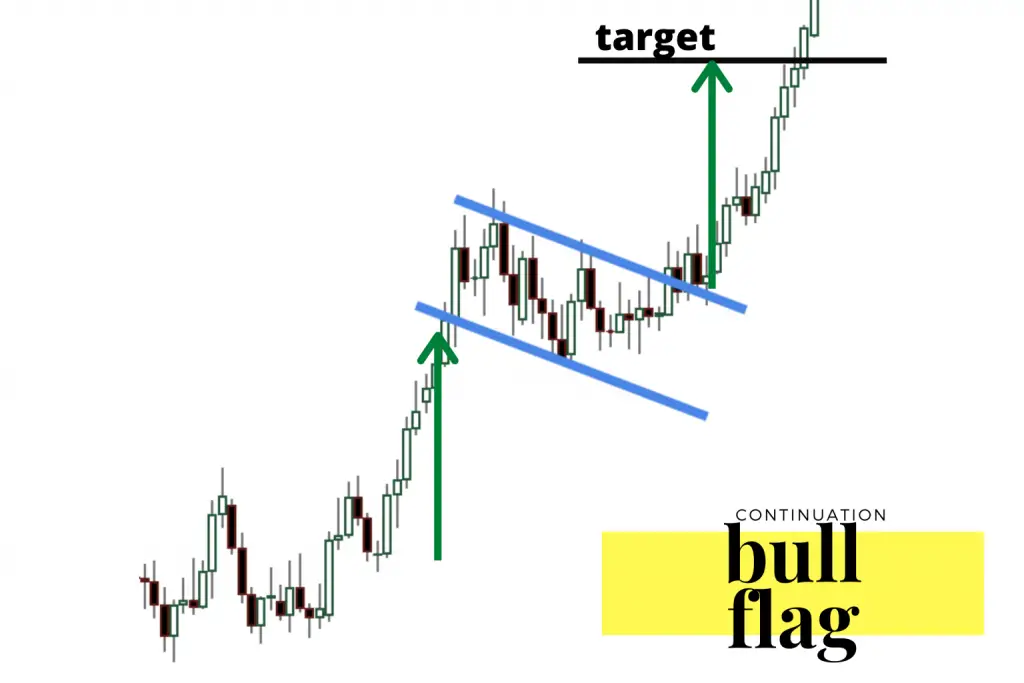
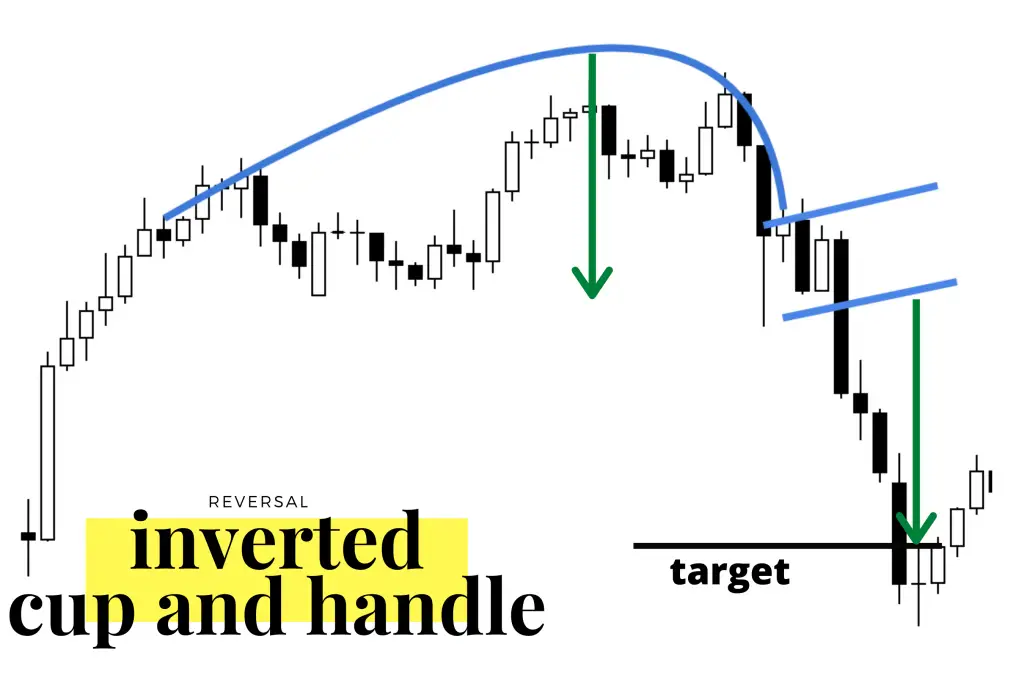
Stock chart patterns are simply a visual representation of the prices buyers and sellers bought and sold at in the past. There is no magic in a chart pattern they just show you what happened in the past and what has a higher probability of happening in the future. The best use of chart patterns […]
Stock Chart Patterns 101 Read More »


