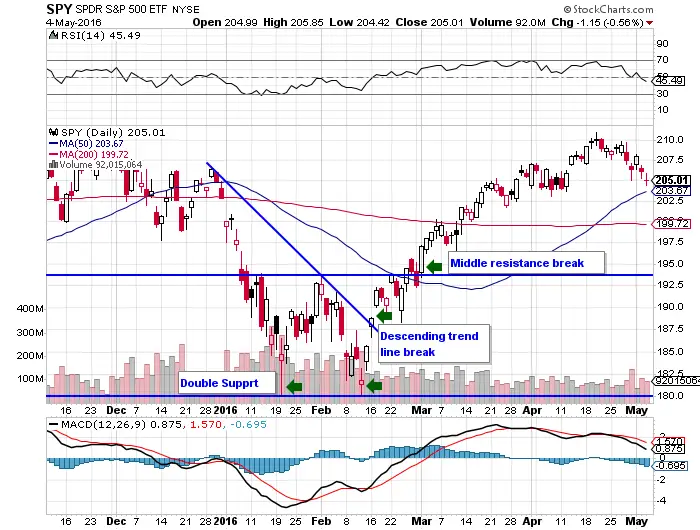
Double Bottom Chart Pattern Explained
The Double Bottom Chart pattern is a bullish reversal pattern. This pattern is created when a key price support level on a chart is tested twice with a rally between the two support level tests. A double bottom chart pattern happens at the end of a downtrend that has likely gone on for weeks maybe months. […]
Double Bottom Chart Pattern Explained Read More »
