“The financial markets generally are unpredictable. So that one has to have different scenarios… The idea that you can actually predict what’s going to happen contradicts my way of looking at the market.” -George Soros
While the longer term up trend is in place it is looking wobbly with many leaders retreating to their 50 day lines $SWI $MLNX $KORS and $ALGN. Apple may join them this week if the selling continues.
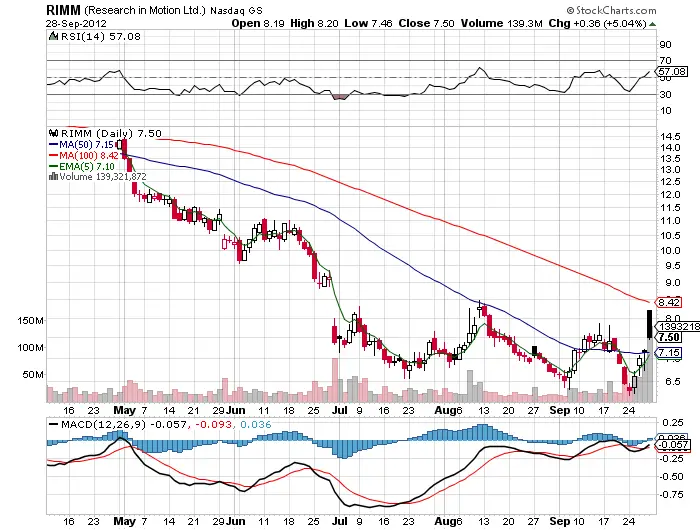
I entered $RIMM short close to the $8 price area as it failed at the daily highs and reversed to make new daily lows. This is a great entry becasue it will need to take out Friday’s highs to stop me out, and there appeared to be no buyers at those levels Friday even after the ‘better than expected revenues and earnings ‘ which were still dismal by any measurement. It appears highly probable that $RIMM fills the recent gap back to the 50 day line at $7.15. With no catalysts for $RIMM until the Blackberry 10 launch in the 1st quarter of 2013 this one could return to new lows. I am holding 21 weekly in the money put contracts on this one.
“What seems low and cheap generally goes lower.” -William O’Neil
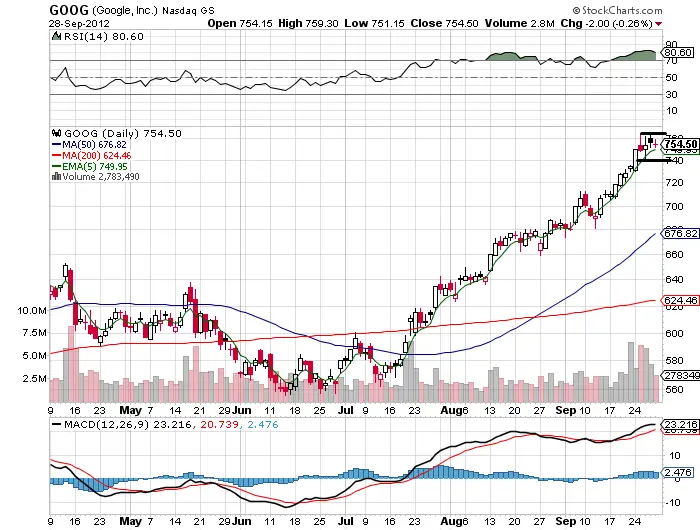
While Google was my big winner for September last week it settled into a range but maintained the 5 day ema as support. Watch the 5 day ema line closely. If you want to be long that is where the best entry will be. If the 5 day ema line is lost the next stops are the 10 day sma and 21 day ema for possible lower buy points. With the current market action I would even advise selling at near $760 to capture profits in this over extended run. However if we close above $765 that will be new momentum and I would be back in aiming at $800.
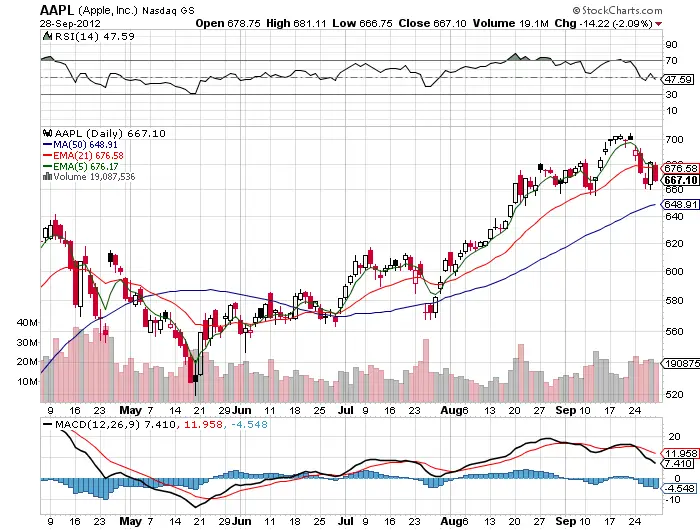
Last week Apple resistance was the 5 day ema and it did not find support at the 21 day ema. $660 was the line in the sand. I will be a buyer in three scenarios,a close above the 5 day ema, at $660 at an intra-day bounce ( if I am fast enough), or a bounce off the 50 day line. If my entries are off $660 or the 50 day line I will look to get out near the 5 day ema. If I am a buyer above the 5 day ema at close I will let it run with the new possible momentum. This is a time to be cautious and let the price hit your buy point. Many traders got burnt chasing this one last week. We may be in a buy the dip sell the rip mode for a while. But this is still the greatest company in the world at great valuations and blow out sales.
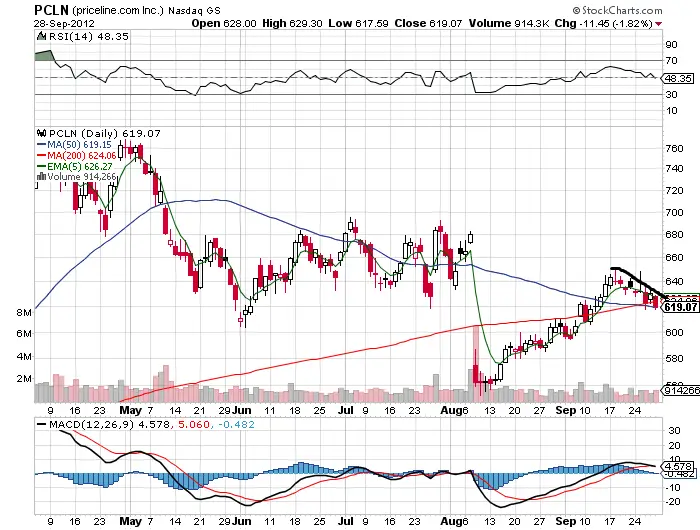
Priceline failed to break out and run and actually went into a down trend last week. Currently the 50 day is acting as support but this could change any day. While the fundamentals have not changed the chart has after earnings. It looks to me to be under distribution and holders are selling every chance they get. I do not see much trend potential in either direction for this beat up leader. Great fundamentals and a terrible chart. I would prefer both to be good or bad for a trend to emerge. Good bye old friend, for now.
I am focusing on only the best probability trades and trends next week, this market is in no man’s land and volatile. We could be in a correction or the beginning of the market rolling over. I am trading smaller and more focused next week waiting to see the markets trend and range show itself more clearly.


