-
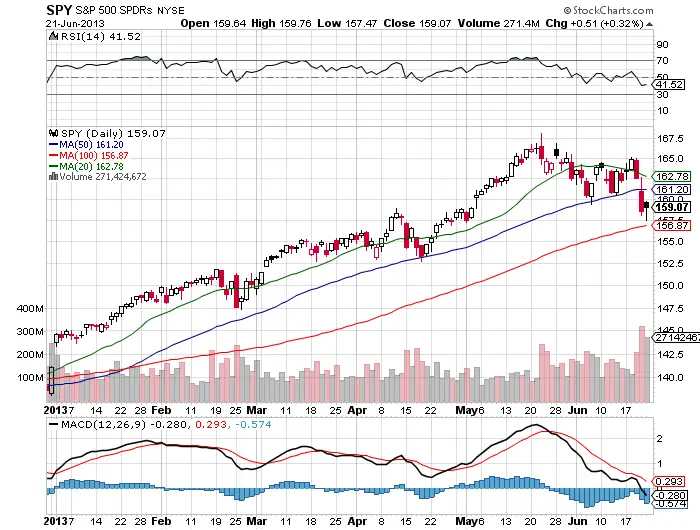
For the first time in a long time we did not get the relief rally after Bernanke spoke, the markets did not like what was said and sold accordingly. The clean break of the 50 day should have been like a bell ringing to bulls that we are not in Kansas anymore Toto.
-
After breaking above the 20 day the market completely rejected higher prices. The odds are against rallying back above the 20 day anytime soon. We now have more buyers trapped and waiting to get out which they are likely to do given an opportunity back at the 20 day.
-
We switched from a “buy the dip” market to a “sell the rally” market. Shorts will be looking to initiate short positions on rallies back near the 50 day sma.
-
We are now in a situation where the 50 day will act as resistance and the 100 day as support. We did get a bounce near the 100 day Friday.
-
Do not get too big and confident in buying support levels in round numbers or key moving averages, true down trends and bear markets do not really have long term support areas only resistance as they make lower lows.
-
For excited bears be aware that down trends are not as smooth as up trends and their will be many strong fake rallies that will occur as shorts cover and dip buyers step in at key levels, the odds are that these will be bull traps.
-
The chart is technically broken for me to even consider going long I would have to see a new price range develop over the week, or a bounce off the 200 day to show support. The 100 day is no man’s land it could go either way.
-
I will be looking to take shorts at key resistance levels like the 50 day or 20 day.
-
I will be trading smaller than usual and from the short side only.
-
You have to take entries faster than usual in this market they come and go quickly.

