-
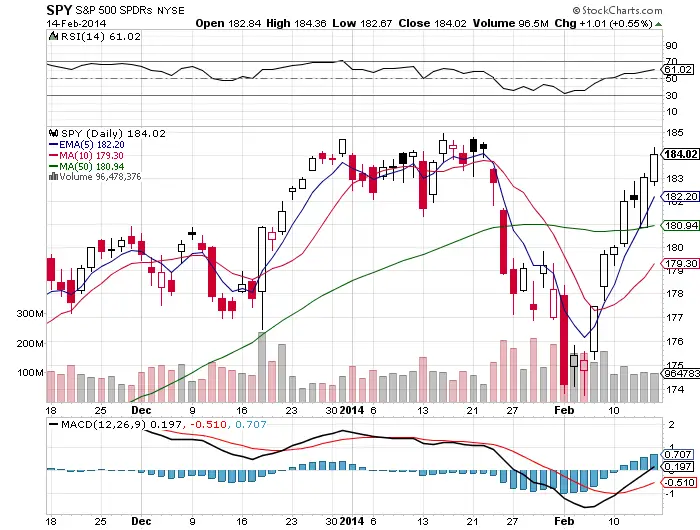
We had a very bullish ‘V’ shaped bounce at the $174 price level right at the 30 RSI level last week that is bullish.
-
We are in striking distance of the $SPY all time high next week. The odds are that we get there next week.
-
This move off the lows has become parabolic and is very overextended from both the 5 day ema and 10 day sma. Odds are we touch the 5 day ema next week at some point.
-
The next resistance level is at all time highs that may cause price consolidation before a possible move up.
-
If the up trend continues and all time highs are broken look for the 70 RSI to act as resistance and stall out the up trend
-
Shorts have been hurt in the past seven trading days so they will become more cautious at shorting into strength.
-
If we get to all time highs look for a strong move on that break out as stubborn shorts will be forced to cover if we get there.
-
As the long term up trend is still in place the intermediate trend is starting to become range bound.
-
So far 2014 has been a traders market in the stock market indexes, buy and holders, trend followers, and investors have made no profits this year and are being out performed by swing traders and good day traders.
-
The levels I am watching is to get long on a retest of the 5 day ema, buy the all time high breakout as it happens, or sell a credit spread as the 70 RSI is approached.
Chart courtesy of Stockcharts.com

