-
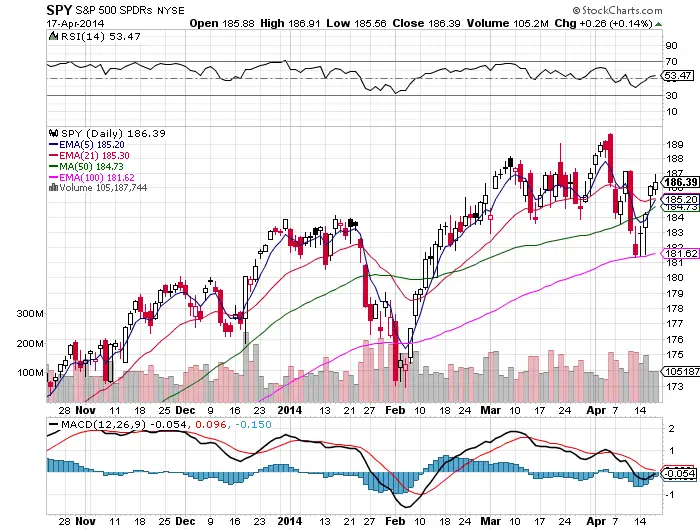
The long term and intermediate term trend are both starting to become range bound here.
-
100 day ema hold and bounce last week was bullish short term.
-
50 day ema broken to the upside again was bullish.
-
5 day ema has almost crossed over the 21 day ema which could lead to a short term trend up.
-
50 day sma and 100 day ema are still both sloping up along with short term moving averages.
-
$187 $SPY is the near term resistance on the chart and if that breaks then the all time high is next up as resistance. A close under the 50 day sma will be a sign of a broken up trend.
-
It is time to be cautious with so much rotation into the energy, consumer staples, and utility sectors of the equity markets.
-
The market continues to be resilient with all the Ukraine headline risk, ‘buy the dip traders’ are still alive and well and the market is still biased long as oversold plunges are bought.
-
Some leading stocks setting up at buy points via Chart your trade. Individual stock charts are beaten down but not broken yet. In a strong down trend individual stocks will not be setting up to the long side.
-
One crack in the bull’s horns –> Caution For Long Stocks When Long Calls Fail
