This is a Guest Post by: Colibri Trader @priceinaction. This article is used here with permission and originally appeared here on ColibriTrader.com.
Despite being a price action trader myself, I simply cannot ignore some important patterns. For decades, technical traders use a pattern recognition approach to forecast future prices.
The very definition of a pattern appeals to technical traders. It means the market move falls into specific rules. These rules define the pattern.
As such, chances to profit from the market move increase considerably. How is that possible?
 The answer is very simple. When traders suspect pattern forms, they know in advance what to expect.
Therefore, they know how to set the money management in such a way to correspond with the overall strategy. Risk will be easily defined. The reward as well.
A pattern recognition approach allows putting some boundaries in the price action of a market. When compared with other traders, that have no idea about what the market might do, traders that use such an approach could have a competitive advantage.
However, lately, things turned out to be more complicated. Technological advances lead to high-frequency trading (a.k.a. robots, expert advisors, quants, super-computers).
Often, they’re programmed to simply take the previous high or low. Or, to buy or sell based on the outcome of an economic release. Also known as High Frequency Traders (or HFTs), they are simply market making algorithms that can take you out of a position in a blink of an eye.
On top of this, more and more people joined the trading arena. Retail trading flourished in recent years. The increased number of Forex brokers that compete in a tough market tells us retail traders pour in the Forex market.
Did you know: Yet, most of them fail. Over ninety five percent of retail traders lose money. It is a frustrating statistic.
Defining a Contracting Triangle
Because more and more people look at the same patterns, they became too obvious. This means they’ll fail more than they work.
This happens especially on the smaller time frames. On the higher ones, anything above 4H and daily, classical technical analysis still works like a charm.
Moreover, traders adapted them to the Forex market volatility. As a result, great trades appear.
 Like the name suggests, a contracting triangle shows price action…contracting. In fact, a contracting triangle only shows price building energy.
According to the Elliott Waves Theory, contracting triangles form often. The pattern is so common, that Elliott discovered many types of them.
IMPORTANT: No matter the type, a triangular formation can only have five legs. No more, no less. Elliott labeled the legs with letters (a-b-c-d-e), to show they are corrective waves.
Moving forward, we would refer to these letters when discussing a triangle.
The A-C and B-D Trend Lines
As mentioned earlier a triangle’s nature comes from the way price behaves within the triangle. This becomes obvious when traders draw two trend lines: the a-c and b-d trend lines.
These lines simply connect the end of the four waves. Furthermore, traders project them on the right side of the chart.
Most of the times, the trend lines contract. As such, a contracting triangle can be identified.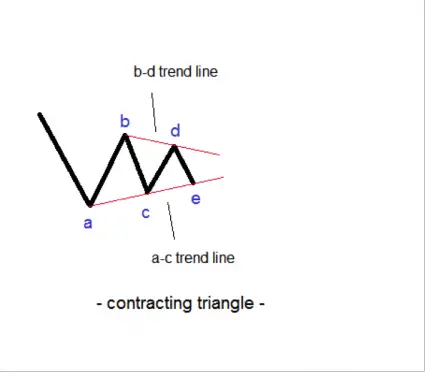
The image above shows the a-c and b-d trend lines pointing toward a common point on the right side of the chart. As such, they contract. Hence, this is a contracting triangle.
USDJPY and the 100 Level
The perfect place to find a contracting triangle is ahead of important psychological levels. These are usually round numbers.
For whatever the reason, traders find round numbers important. Levels like parity (1), or 100, resonate with many. Stop loss orders, take profit levels, or other pending orders surround the area.
The perfect example comes from the USDJPY pair. A few years back, it traded well below the 80 level. That is, until Bank of Japan intervened.
The Japanese central bank launched an unprecedented bond-buying program. As a matter of fact, the program runs to this day.
Under it, the central bank buys its government own bonds. That’s called quantitative easing. It results in the currency losing value.
JPY was no different. In an instant, it began selling across the board. The trend that started proved to be extremely aggressive.
From below 80, the USDJPY pair jumped to almost 100. However, just before taking the round number, the pair dipped over four hundred pips. How come?
At a closer look, the pair failed to take the level by less than six pips. Is this possible after a more than two thousand pips trip? Unlikely.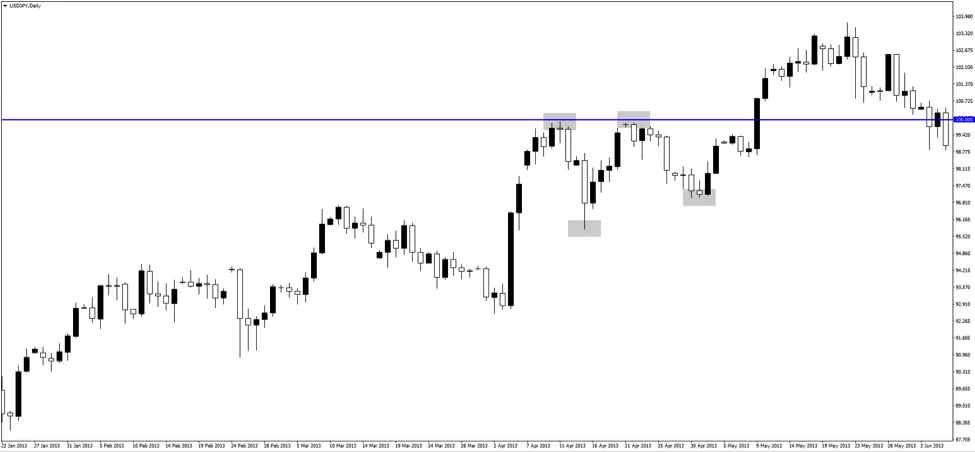
As it turned out, the pair simply built energy to break higher. At first, it was strongly rejected.
However, it did a re-test. Only to fail for a second time.
But, the new swing lower failed to take the previous low. This makes the case for a higher low series. In turn, this led to a triangular formation.
As the chart above shows, in the end, it formed a bullish flag right before blasting through the 100 level. The move above was so strong, that many traders that had pending buy stop orders were filled at higher levels. That is, assuming they traded with ECN (Electronic Communication Network) or STP (Straight Through Processing) brokers.
Labeling the USDJPY Triangle
When the market consolidates, it builds energy to break out. In this case, it broke higher.
As can be seen from the labelling above, a triangle looks like that in the chart above. The most important trend line is the b-d one. When the market breaks it, the triangle ends.
Hence, the consolidation ended, and a new trend starts. In this case, being the daily time frame, the consolidation took over twenty trading days. Almost a month the price struggled to break this bullish triangle.
This is not an ascending triangle, though. An ascending or descending triangle has the b-d trend line forming on the horizontal. It still shows the price building energy before breaking higher/lower.
Price Action After a Contracting Triangle
Depending on the trading theory used (Elliott Waves Theory, for example, is full of contracting triangles and their interpretation) or the technical analysis style, triangles have different names.
Classical technical analysis calls them ascending or descending triangles. They are nothing but contracting triangles looking to break higher or lower.
Or, other triangles are symmetrical ones. In principle, the idea is the same. The market takes its time and consolidates.
Further distinctions have been made about the subject. As such, the following terms appear:
- Limiting triangles. The price action that follows a triangle like this has “no legs”. It means the break higher/lower is interpreted as a fake one.
- Non-limiting triangles. The price action after it has no limitation.
- Running triangles. Tricky patterns, these creatures end above/below the start of the triangular formation. Very difficult to interpret and analyze it.
- Triangles in the a-e baseline. If the a-e and the b-d lines contract, this is a valid technical pattern.
- Triangles in the c-e baseline. The same as above. If the trend lines contract, the triangle will run its course.
Retesting the B-D Trend Line
Like the USDJPY example showed, a bullish triangle breaks higher. And, a bearish one breaks lower.
All eyes should be on the b-d trend line. This is the most important one as its breaks signal the triangle ended.
On the daily USDJPY, the bullish flag the market formed for the e-wave, was right below the b-d trend line. In other words, one cannot miss such a formation.
I mean, you know the triangle is bullish and the 100 level will be triggered. All you need to do is to wait for the triangle to break. Hence, to be patient.
In the meantime, the price forms a bullish flag, for a few days. Who says technical analysis doesn’t work?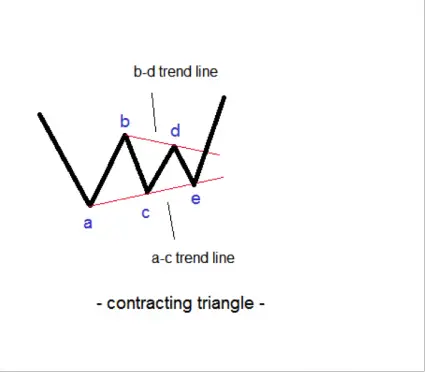
However, not all triangles look like that one. Most of the times, the a-c trend line gets pierced by the e-wave.
Moreover, when the b-d trend line breaks, typically it gets retested. A proper representation of the price action that follows a b-d trend line break looks like the chart below.
The Elliott Waves Theory goes further into more details regarding the retest. While not mandatory for ALL triangles, specific triangular formations MUST see the b-d trend line retest.
As such, a retest offers the opportunity for a great trade. The absolute invalidation (or the stop) should be at the end of the e-wave. The target, on the other hand, should have minimum 1:2.5 or more as a risk-reward ratio.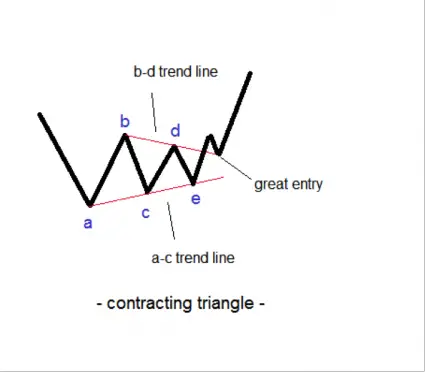
Trading the Apex of a Contracting Triangle
One of the most important features of a contracting triangle is its apex. This is the intersection point, the place where the a-c and b-d trend lines meet.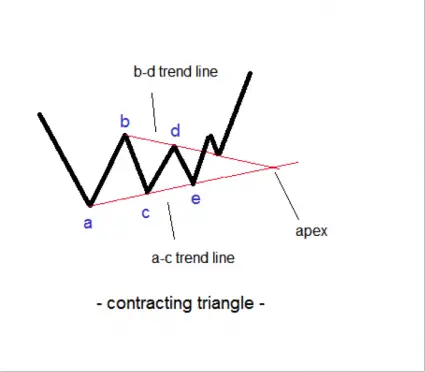
The apex may, or may not be visible. This depends on the angle of the two trend lines that make the contracting triangle.
For example, the image above shows the apex because the b-d and a-c trend lines contract aggressively. But, a contracting triangle contracts if the two trend lines are not parallel.
Therefore, it happens that the apex of a contracting triangle to be somewhere on the right side of the chart when the trend lines are almost parallel.
Funny enough, few people know that the apex exists even in the case of an expanding triangle. The only thing that differs is that it is to be found on the left side of the chart.
Why is this important? What to use the apex for?
Depending on the type of the contracting triangle, the apex can be extremely important. If the market forms a limiting triangle, for example, the apex acts as a bellwether.
It gives strong support and resistance for future price action. Moreover, depending on where the triangle forms, by the time the apex breaks, it implies the previous trend ended.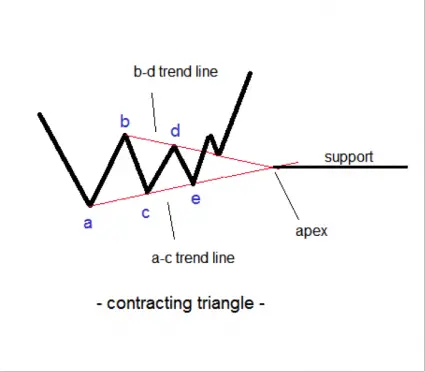
The image above shows the apex as a horizontal trend line drawn from where the a-c and b-d lines meet. When the apex is visible, like in this case, it will offer important support and resistance for future prices.
This is especially true when the triangle forms on the bigger time frames. Daily, weekly or even higher time frames result with super-strong support/resistance levels given by the apex.
As usual, when the support breaks, it becomes resistance. And the other way around is true as well.
Conclusion
Contracting triangles form everywhere in the financial markets. They are especially looked for in the Forex market.
Because of high-frequency trading and the algos that govern this market, most of the times prices consolidate ahead of an important economic release. The problem is that important economic data comes way too often.
Hence, the market consolidates most of the times. The algos are programmed to buy or sell in big chunks only when the news hits the wires.
As such, every first Friday of the month the NFP (Non-Farm Payrolls) comes out of the United States. Guess what is the Forex market doing for the whole week? It consolidates.
Guess what the pattern is? A contracting triangle.
Every six weeks there’s an interest rate decision in the United States and Europe. Other central banks meet on a regular basis too.
What I’m trying to say is that the reason why the Forex market consolidates most of the times is strongly connected with the number of important economic releases. But, there’s a catch.
This happens on the lower time frames.
The bigger time frames have the big advantage of filtering the noise. Therefore, if you are a trader that likes to position for the medium to long term trade, contracting triangles work most of the time.
As always, patience is key. Moreover, because the b-d trend line is so visible, traders know when the contracting triangle ended.
For those wanting to know more details about how the price action inside a contracting triangle is, Elliott Waves Theory has a set of rules especially for this.
It considers Fibonacci ratios between the legs of the triangle, and some other minimum conditions the price must meet. All in all, Elliott does nothing but putting in place some rules for patterns that, as he noticed, form very often.
Forex traders know that rules define a good money management system. If a pattern has rules to follow, profitable trades result.
When integrated into a clear system, with clear entry, stop and take profit levels, contracting triangles are one of the most powerful patterns the market forms. As with any other trading strategy, money management is what can separate a winning trader from a loser.
Happy Trading,
Colibri Trader
P.S.
If you want to learn more about other types of patterns, check my Candlestick Patterns Article
or maybe you want to know about 3 Less Known Trading Indicators
For more articles by Colibri Trader check him out here on ColibriTrader.com and follow him on twitter @Priceinaction.


