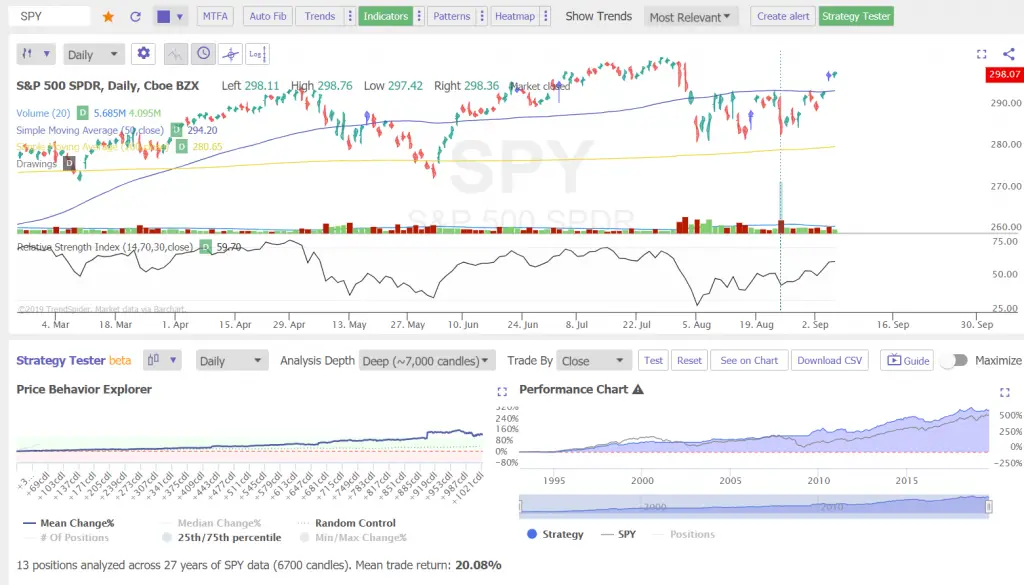
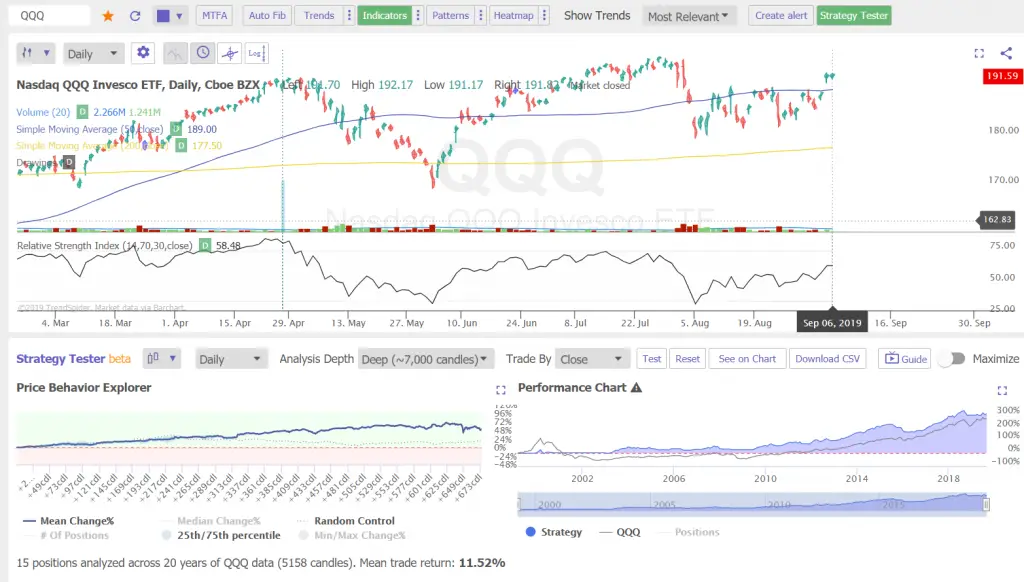
Here is an example of a simple long term profitable trend following system for the $SPY and $QQQ ETFs.
This is backtest data from trading the most popular of all moving average crossover signals the “Golden Cross” that is the 50 day / 200 day simple moving average crossover. This signal goes long when the 50 day simple moving averages closes above the 200 day simple moving average and goes back to cash when the 50 day SMA closes back under the 200 day SMA. This is the backtest data in $SPY from 1993-2019 and from $QQQ from 1999-2019.
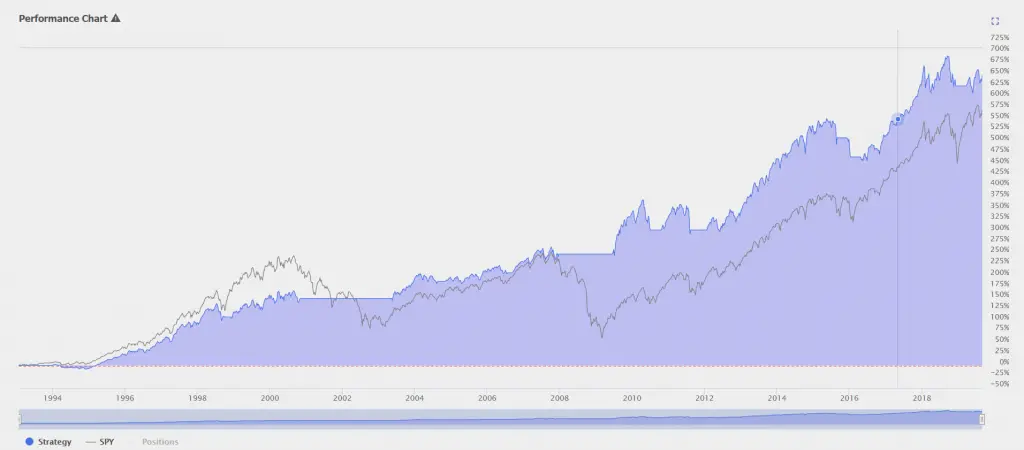
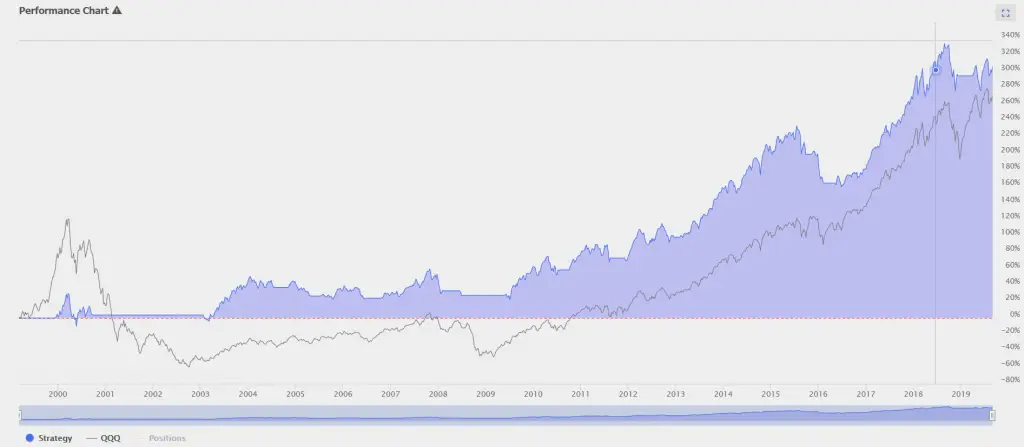
This is really best compared with buy and hold investing and presents a simple alternate that creates more returns than buy and hold investing and cuts the draw down in capital dramatically. It keeps you in bull markets and takes you to cash during bear markets.
The $SPY golden crossover signal mean return is +20.08% per trade, total return over the full test is +625% versus the buy and hold return of 550%. The sharp out performance started after buy and hold took the substantial draw down in 2008 that the crossover avoided.


The $QQQ golden crossover signal mean return is +11.52% per trade, total return over the full test is +300% versus the buy and hold return of 260%. The out performance started after buy and hold took the substantial draw down in 2001-2002 dot-com meltdown that the crossover avoided.


The charts and backtest data are courtesy of TrendSpider.com.