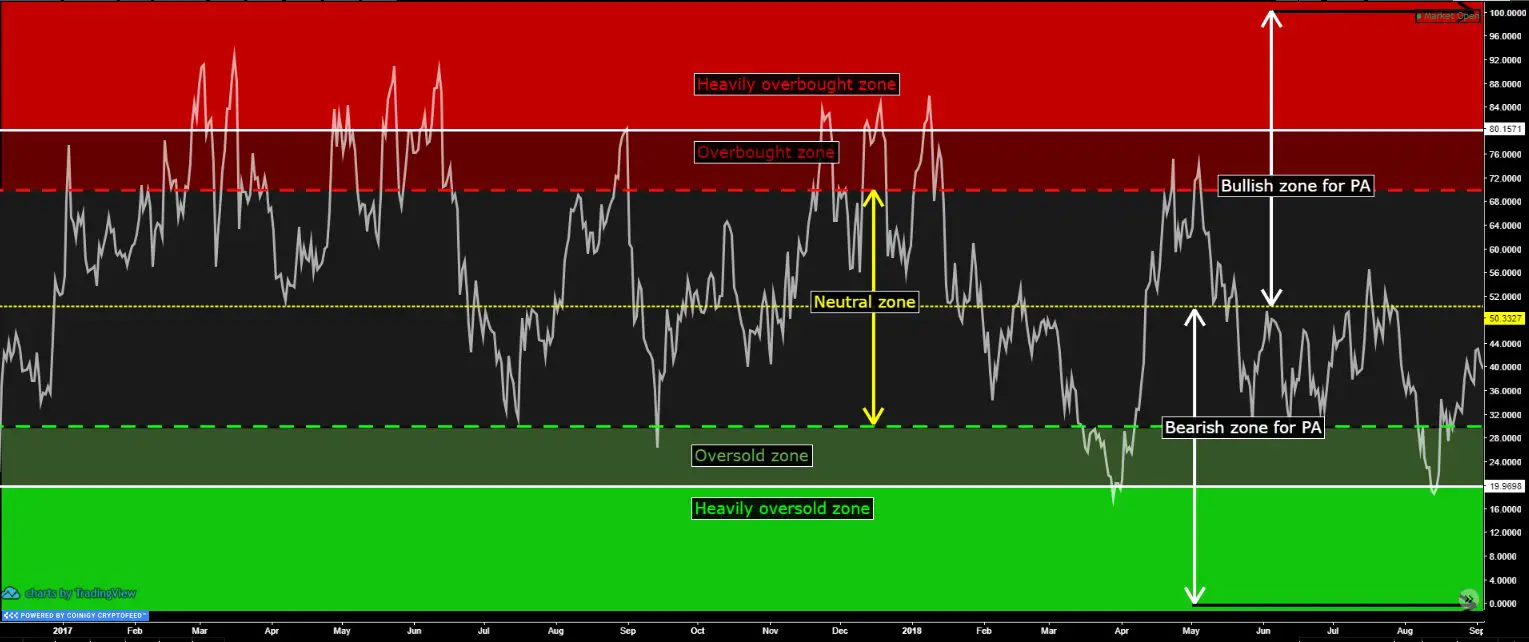
The CCI indicator (commodity channel index) is an oscillator originally created in 1980 by Donald Lambert . He developed CCI originally to identify and quantify cyclical moves in commodity c... Read more
Anchored volume weighted average price or simply AVWAP is a previous meaningful benchmark price on a chart chosen by traders that quantifies the average price a market has traded at through... Read more
The McClellan oscillator is a market breadth technical indicator used by traders to analyze the New York Stock Exchange listings balance between the advancing and declining stocks over time.... Read more
The MACD-Histogram quantifies the distance between MACD and its 9-day EMA signal line. The histogram reads positive when MACD is above its 9-day EMA and reads negative when the MACD is below... Read more
An RSI divergence indicator signal shows traders when price action and the RSI are no longer showing the same momentum. The RSI shows the magnitude of a price move in a specific timeframe. T... Read more
Technical analysis is the art and science of reading price action on a chart. Here is a quick reference guide that can be used as a cheat sheet. A range bound market can be identified by ho... Read more
The VWAP (volume-weighted average price) is the ratio of the value of shares traded to total volume that is traded over a specific time period on a chart. It measures and quantifies the aver... Read more
An ATR trailing stop is one way to manage a trade at both the time of entry as a stop loss setting and if it evolves into a winning trade by exiting when the price reverses far enough to tri... Read more
The MACD is an abbreviation for the moving average convergence/divergence technical trading indicator and is used in technical analysis to filter the trends, swings, and momentum of price ac... Read more
This is a video guest post by Jake @TrendSpider. Chart Courtesy of TrendSpider.com Read more