Bear Trap Stocks
What is a bear trap? Bear trap stocks are ones that have already fallen a lot in price and traders continue to sell it short believing it will continue to…
Helping Traders Thrive
What is a bear trap? Bear trap stocks are ones that have already fallen a lot in price and traders continue to sell it short believing it will continue to…
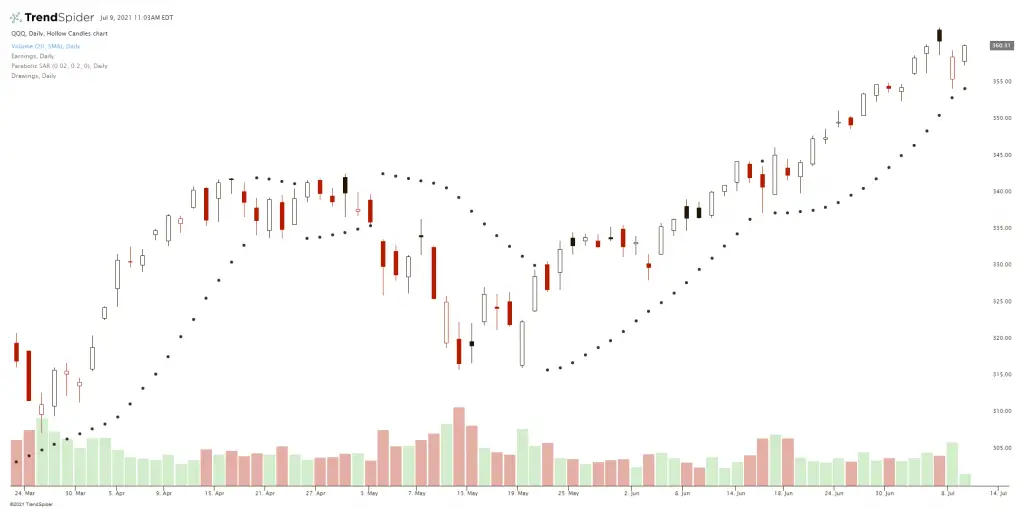
The Parabolic SAR (stop and reverse) indicator is a technical trading tool that quantifies both trends and price reversals on a chart and can be used as a stop loss,…
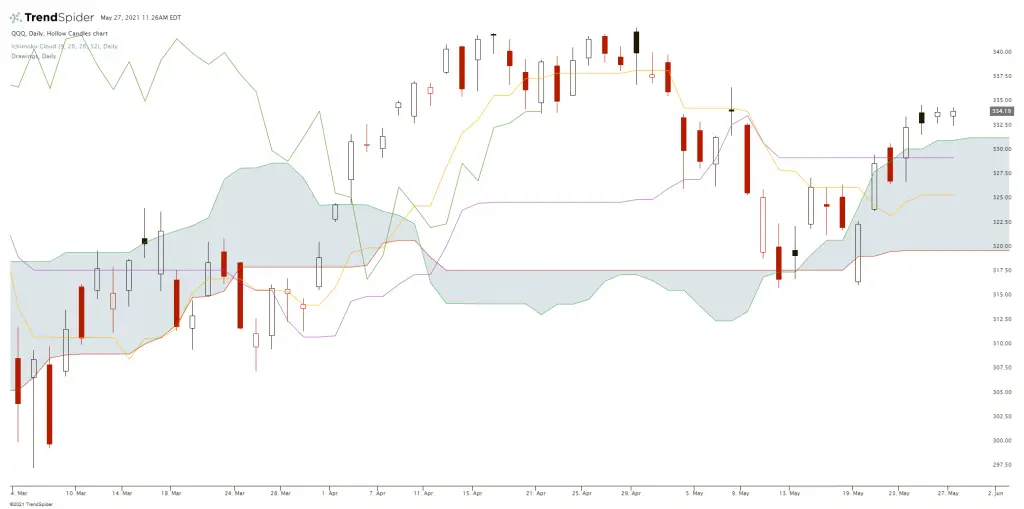
The Ichimoku Cloud is a technical indicator that tries to quantify support and resistance, it identifies the direction of the trend, and measures the momentum to create potential trading signals.…
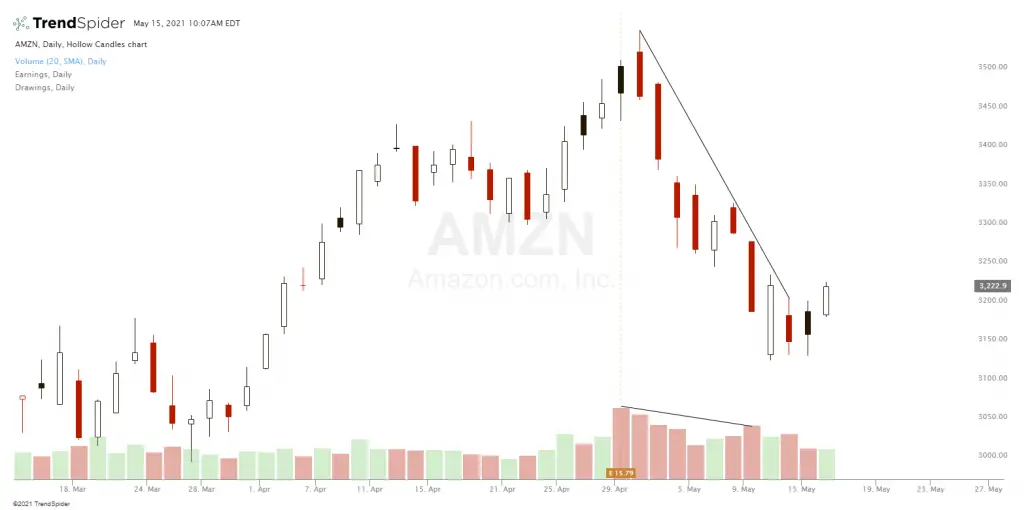
Volume is like votes on the price of a stock as each trade is an agreement between a buyer and a seller to exchange shares. The volume is the amount…
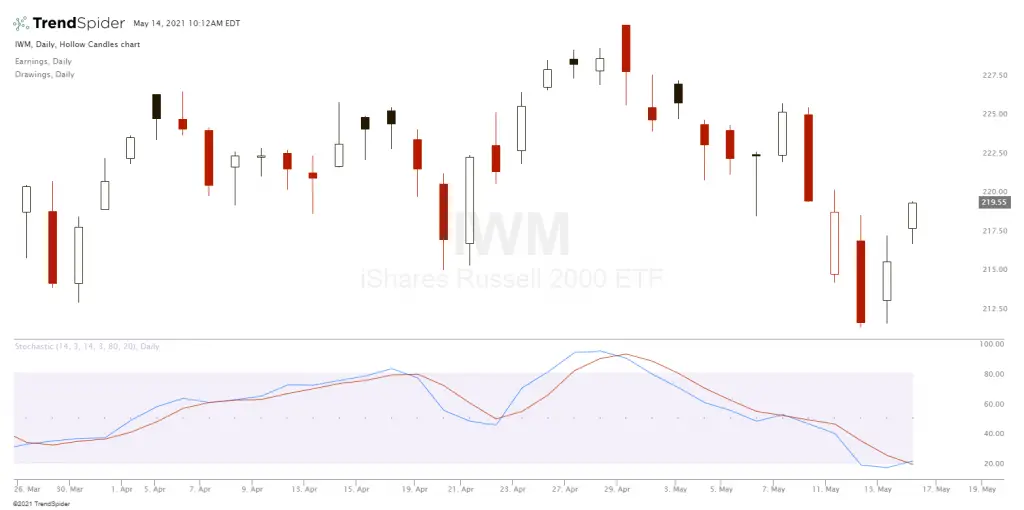
The Stochastic Oscillator is a momentum indicator that measures the location of the closing price on a chart in relation to the high to low trading range over a period…
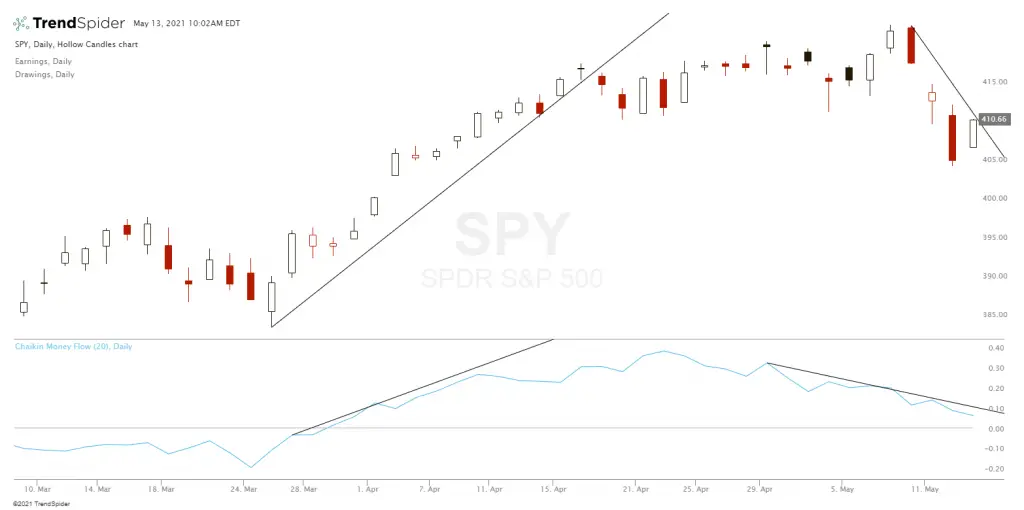
The Chaikin Money Flow or CMF is a technical indicator created by Marc Chaikin and is a volume-weighted average of accumulation and distribution over a specific period of time. The…
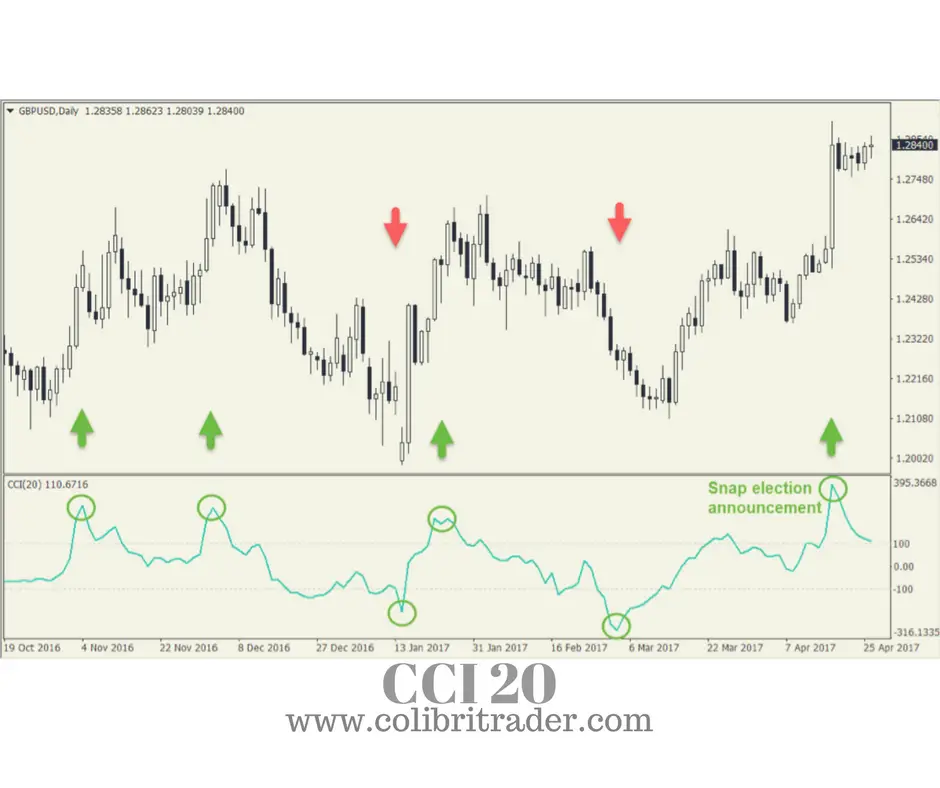
The CCI indicator (commodity channel index) is an oscillator originally created in 1980 by Donald Lambert . He developed CCI originally to identify and quantify cyclical moves in commodity charts,…
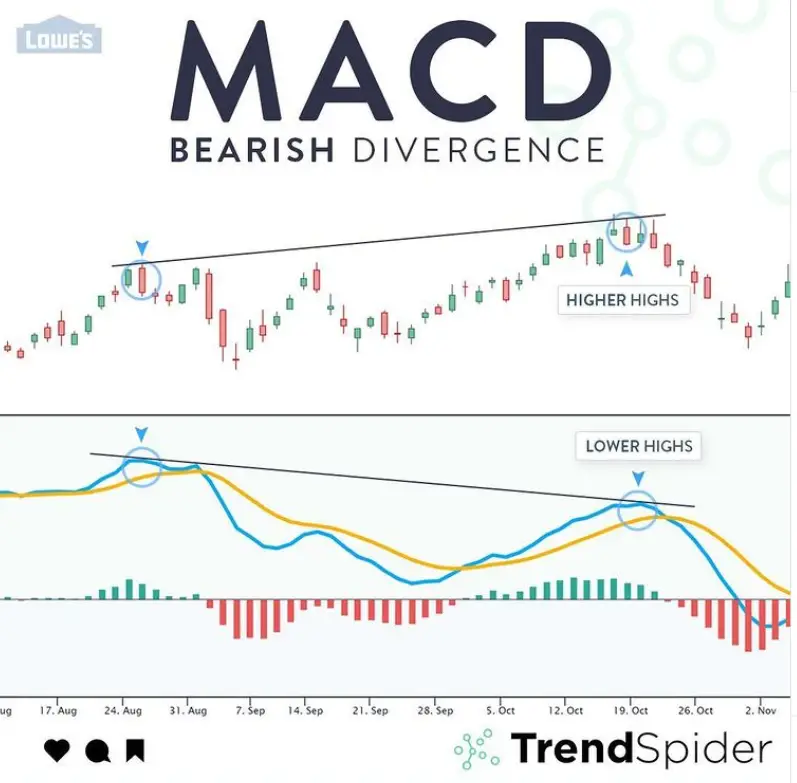
The MACD-Histogram quantifies the distance between MACD and its 9-day EMA signal line. The histogram reads positive when MACD is above its 9-day EMA and reads negative when the MACD…
Technical analysis is the art and science of reading price action on a chart. Here is a quick reference guide that can be used as a cheat sheet. A range…
This is a Guest Post by AK of Fallible. In this video we’re going to talk about what happens when you combine fundamentals and technical analysis. We’ll be answering the…