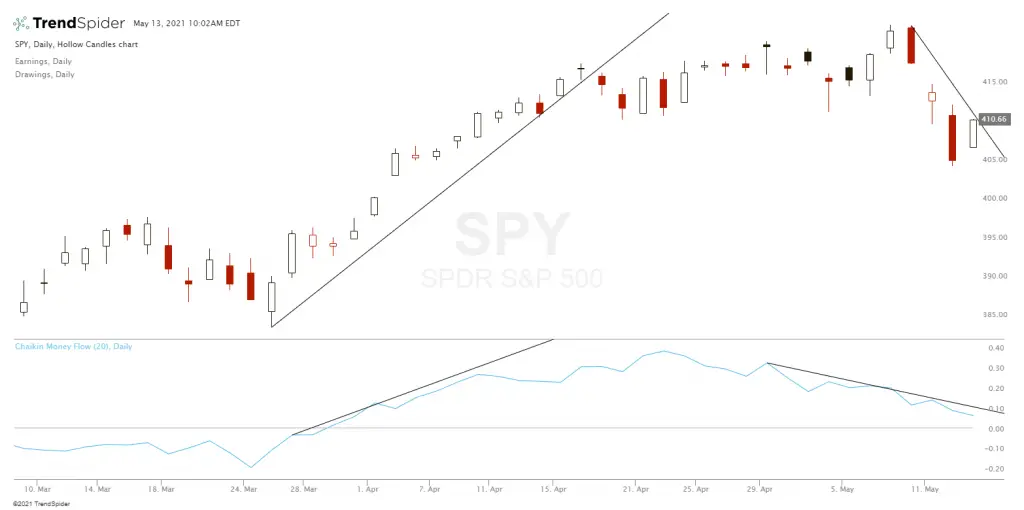
The Chaikin Money Flow or CMF is a technical indicator created by Marc Chaikin and is a volume-weighted average of accumulation and distribution over a specific period of time. The standard time period used for this indicator is 2o days and is usually the default setting on many charting platforms.
The CMF sums money flow volume over a chosen look-back period. The Chaikin Money Flow value fluctuates between 1 and -1 around its zero line.
The concept behind the Chaikin Money Flow is when its reading is near the high of the period, it shows a greater amount of accumulation happened. Also, when the closing reading is near the low, a greater amount of distribution happened. If price action consistently closes higher than the price range midpoint on increasing volume, the Chaikin Money Flow is positive. Also, when the price action consistently closes lower than the price range midpoint on increasing volume, the Chaikin Money Flow will be negative.
If CMF is positive and closer to +1, buying pressure is greater.
If CMF is negative and closer to -1, selling pressure is greater.
Buying pressure can confirm a current uptrend will continue. Selling pressure can confirm a current downtrend will continue. This can give the trader a confluence signal between both price and volume showing a higher probability that a current trend will continue.
During an uptrend, continuing buying pressure with CMF values above 0 can signal prices will continue to go higher.
During a downtrend, continuing selling pressure with CMF values below 0 can signal that prices will continue to go lower.
When CMF crosses the zero line in either direction, this can be a signal that a trend reversal could be near. The CMF value above the zero line is a signal of price strength on the chart, and a value below the zero line is a signal of weakness on the chart.
How to use the CMF indicator for trading:
Bullish crosses occur when CMF crosses from below the zero line to above the zero line.
Bearish crosses occur when CMF crosses from above the zero line to back below the zero line.
The CMF can be used as a technical indicator to confirm a breakout of price action in either direction by using trend lines or support and resistance lines on the CMF indicator in relation to price action. If a price breaks out above price resistance on the price chart it can be confirmed by the CMF when it also has a positive value confirming the direction of the breakout.
A bearish divergence CMF sell signal is triggered when price action has a higher high with an overbought reading and the CMF diverges with a lower high and begins going lower.
A bullish divergence CMF buy signal is triggered when price action has a lower low with an oversold reading and the CMF diverges with a higher low and begins going higher.
