Technical Indicators Cheat Sheet
Here is a great technical indicators cheat sheet graphic created by Tradeciety.com What are the 4 types of indicators? Trend…
Helping Traders Thrive
Here is a great technical indicators cheat sheet graphic created by Tradeciety.com What are the 4 types of indicators? Trend…
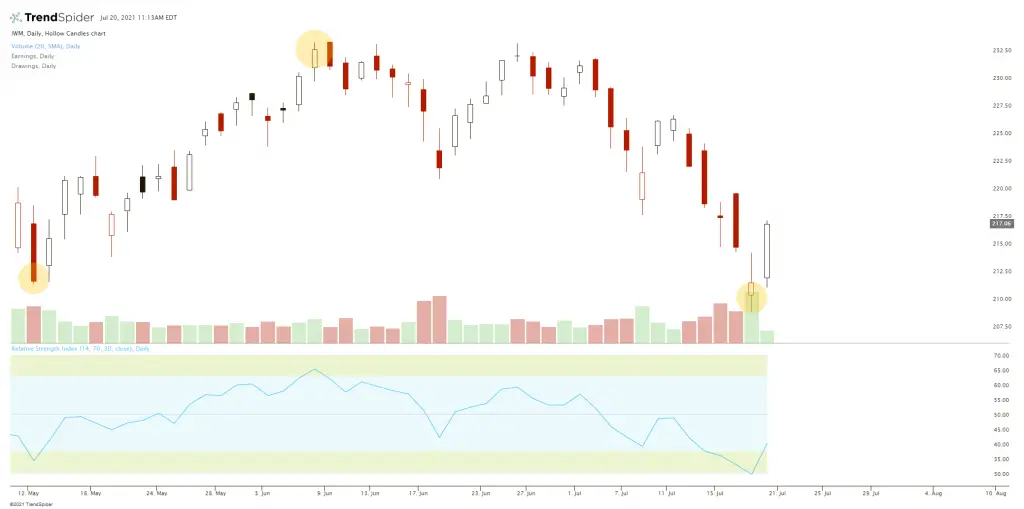
The RSI indicator strategy uses the Relative Strength Index to make buy and sell decisions on a chart based on…
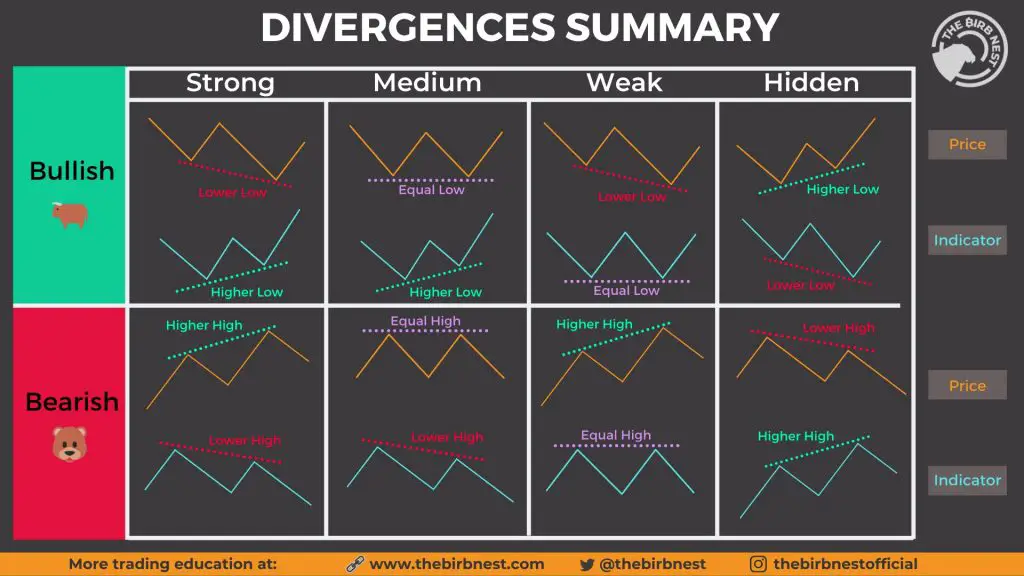
RSI Divergence Cheat Sheet Bullish RSI Divergence A bullish RSI divergence pattern is defined on a chart when price makes…
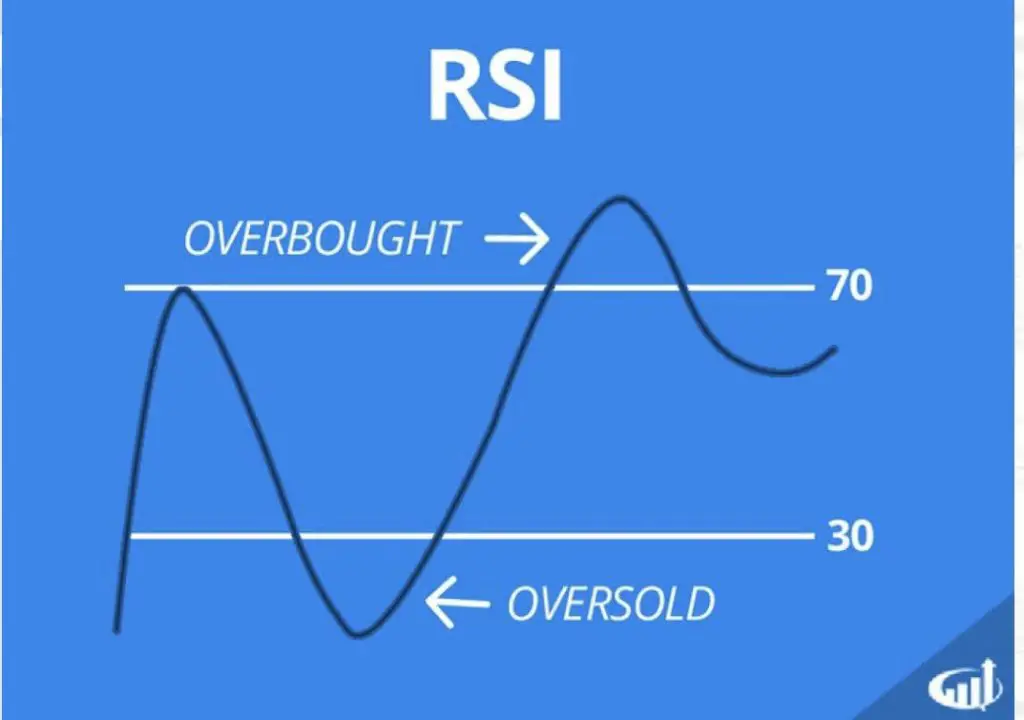
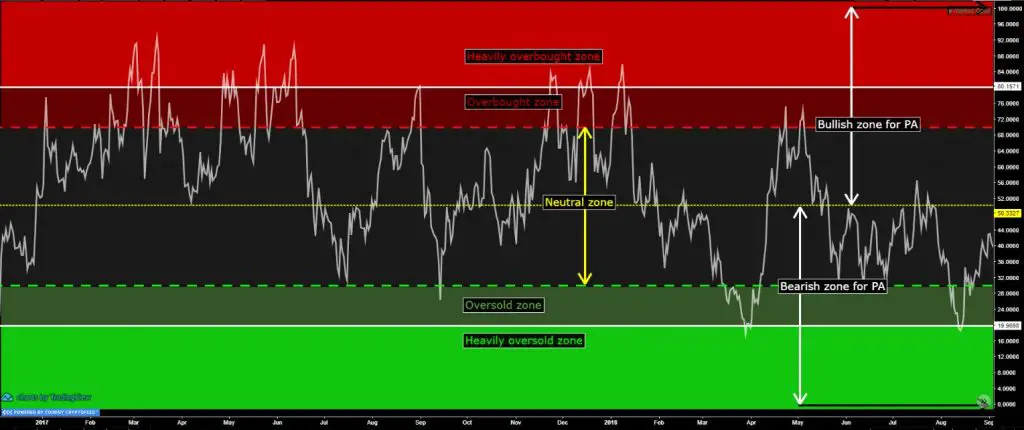
What is the RSI indicator? The RSI indicator buy and sell signals are based on oversold and overbought conditions on…
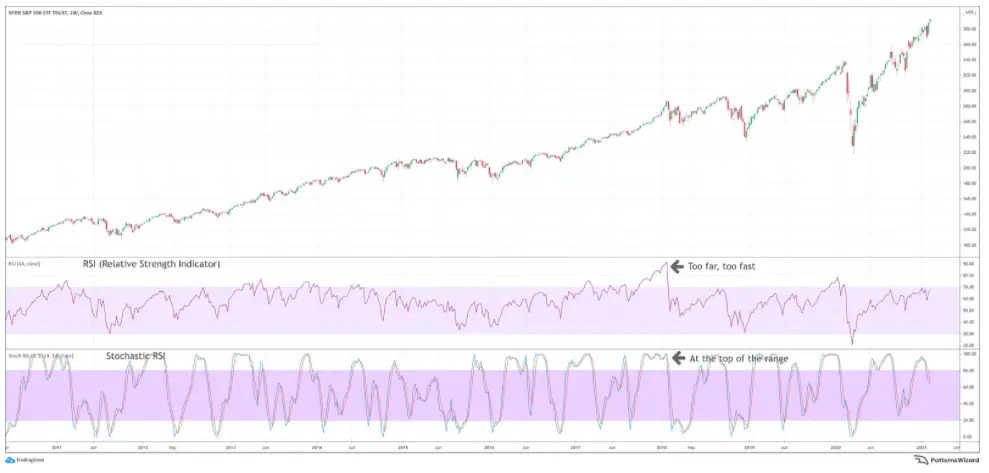
The RSI indicator buy and sell signals are based on oversold and overbought conditions on a stock chart. The RSI…
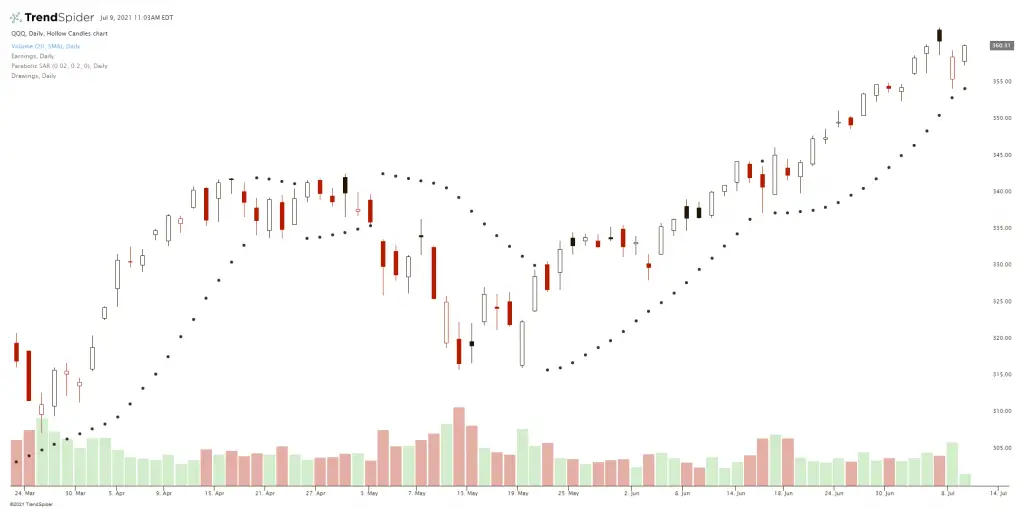
The Parabolic SAR (stop and reverse) indicator is a technical trading tool that quantifies both trends and price reversals on…
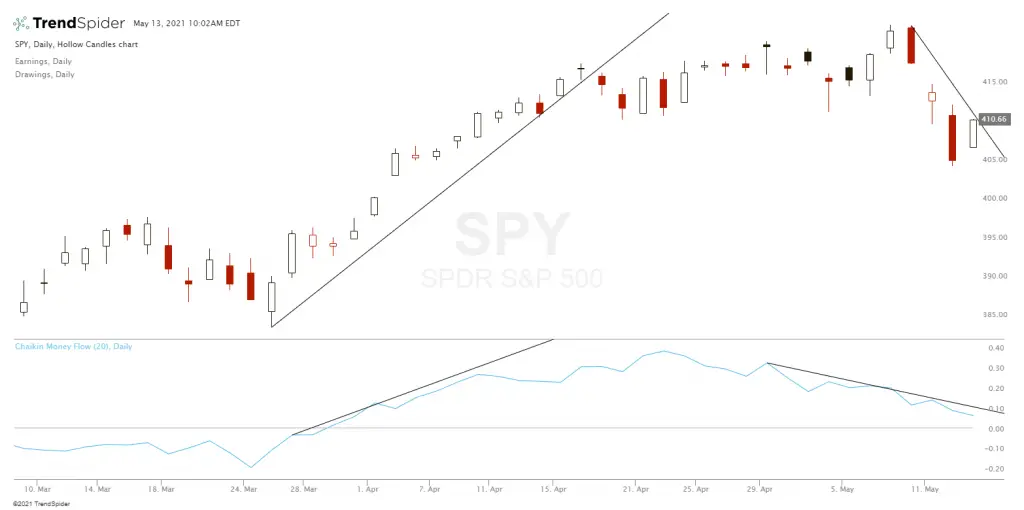
The Chaikin Money Flow or CMF is a technical indicator created by Marc Chaikin and is a volume-weighted average of…
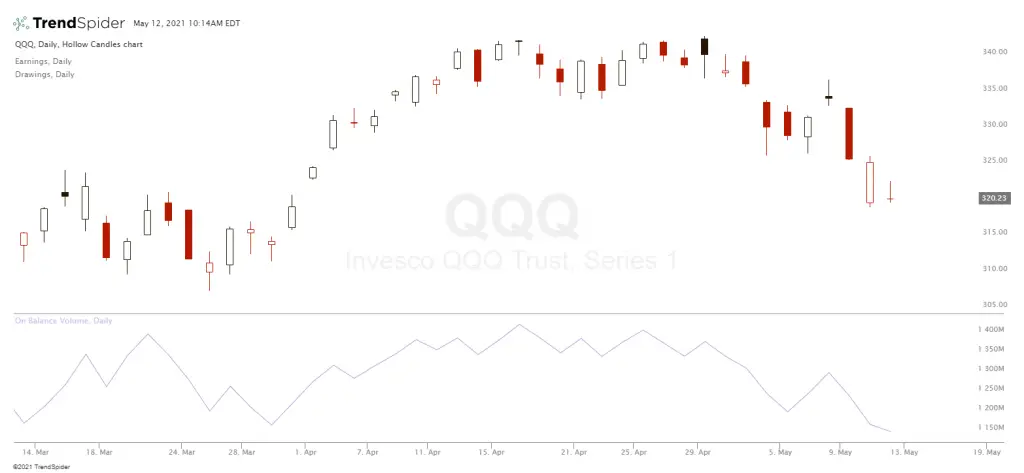
On-Balance Volume (OBV) is a type of momentum indicator that uses volume to project the potential for price change. It…
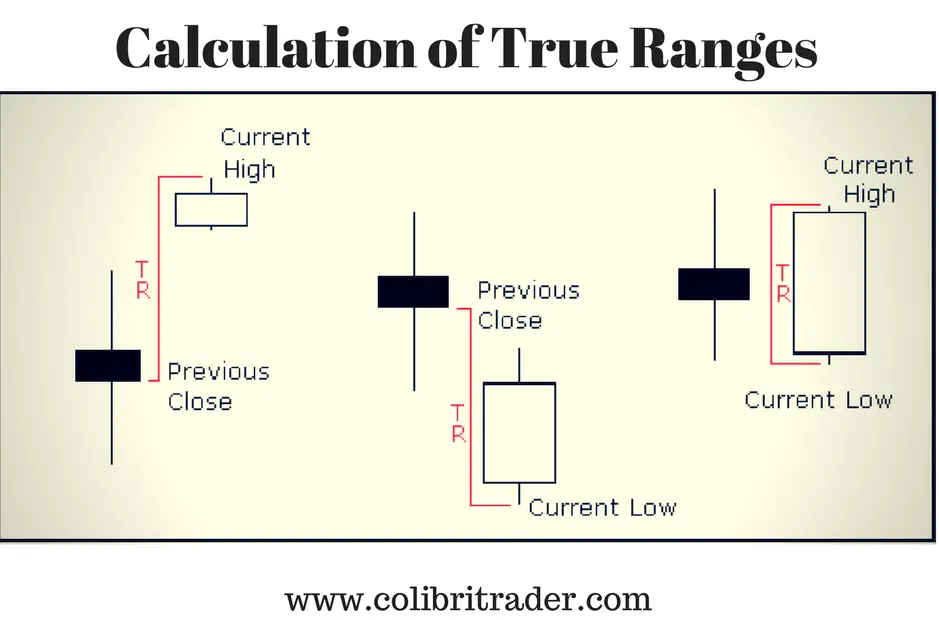
What is ATR? The ATR indicator is the average true range technical indicator used in technical analysis to quantify the multi-day…
The following is a guest post from @PatternsWizard of PatternsWizard.com What is the Relative Strength Index (RSI)? RSI is a technical…