Technical Analysis

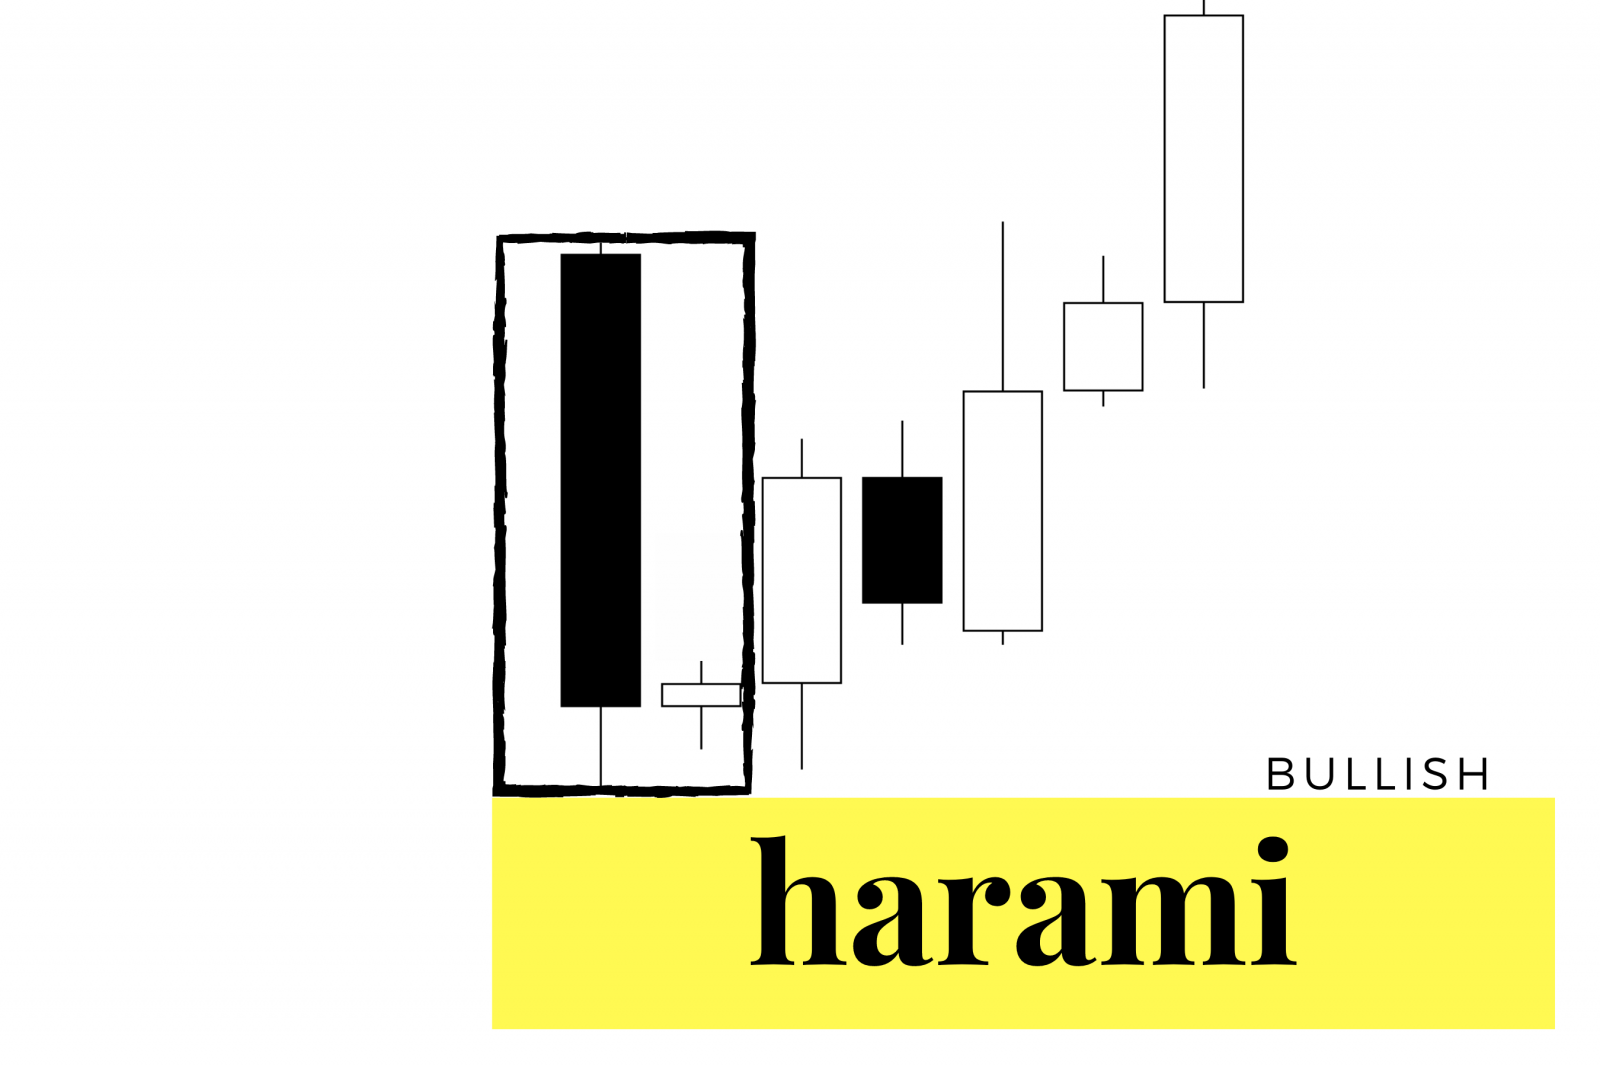
bullish and bearish harami

Bullish and Bearish Harami: Definitions and Trading Strategies

As a trader, your success depends on your ability to identify chart patterns that can help you capture directional market movements. The bullish and bearish harami candlestick patterns are two such patterns that can provide valuable insight into potential trend reversals. The bullish harami, which consists of a small bullish candle that falls within the …

Bullish and Bearish Harami: Definitions and Trading Strategies Read More »

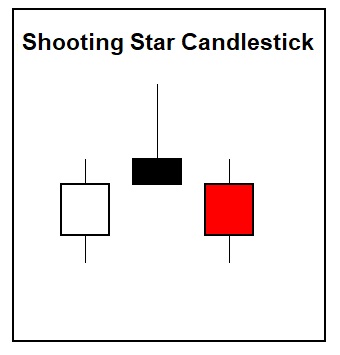
Shooting Star Candlestick Pattern

Shooting Star Candlestick Pattern: What It Means in Stock Trading, With an Example

What Is a Shooting Star? A shooting star candle or pin bar reversal is a bearish candlestick pattern appearing during an uptrend on a chart. A shooting star tends to have long upper wicks and almost no lower wicks, along with a candle body that is usually small. A shooting star usually happens when a …

Shooting Star Candlestick Pattern: What It Means in Stock Trading, With an Example Read More »

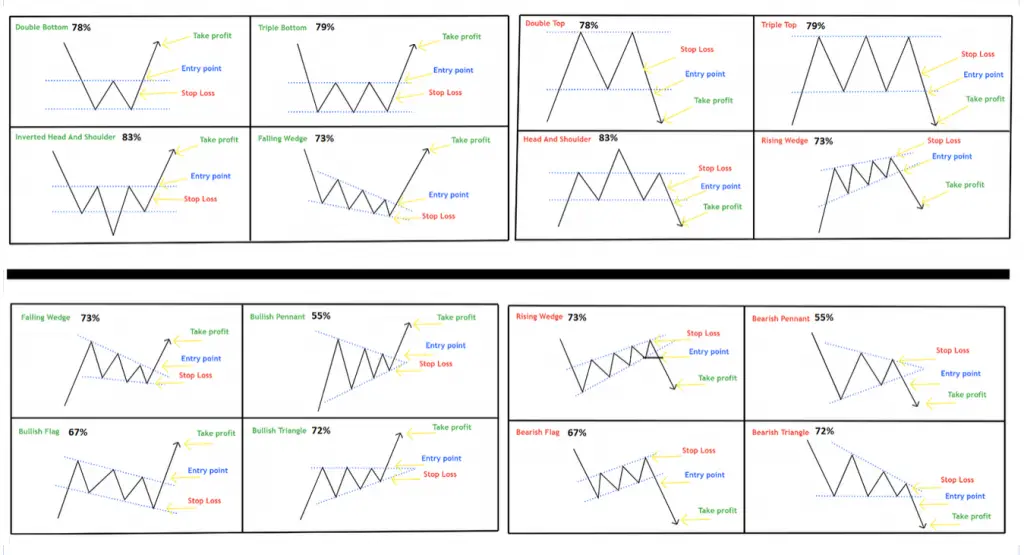
Chart pattern cheat sheet

Technical Analysis is Hard (Until you see this)

Technical analysis is used by traders or investors to analyze charts to identify patterns in the market price action data to identify trends and trading ranges to either react to what is happening now or make predictions about the future. There are two major types of technical analysis: predictive technical analysis and reactive technical analysis. …

Technical Analysis is Hard (Until you see this) Read More »

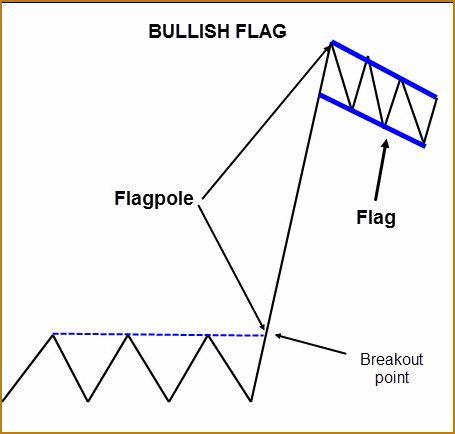
Chart Pattern Cheat sheet

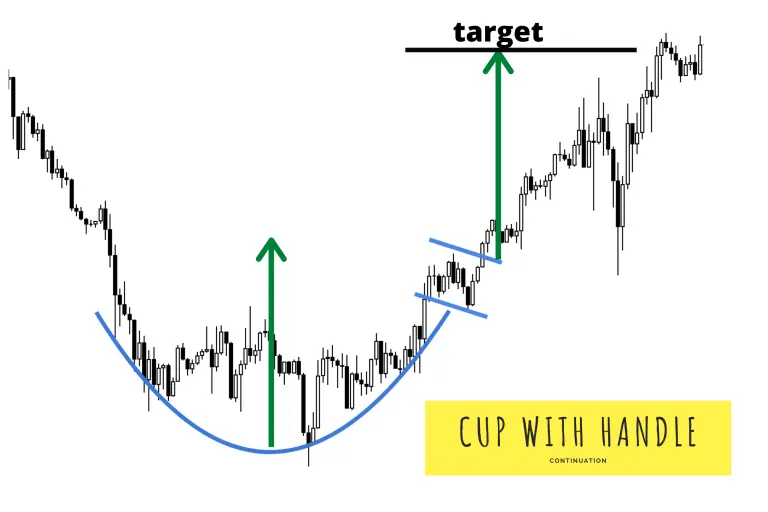
Chart Patterns in Technical Analysis

How many types of chart patterns are there? There are three main types of chart patterns which are used in technical analysis: traditional chart patterns, harmonic patterns, and candlestick patterns. Traditional Chart Patterns Traditional chart patterns identify the behavior of traders and investors on a chart based on support and resistance trend lines. The purpose of …

Chart Patterns in Technical Analysis Read More »