What Is a Shooting Star?
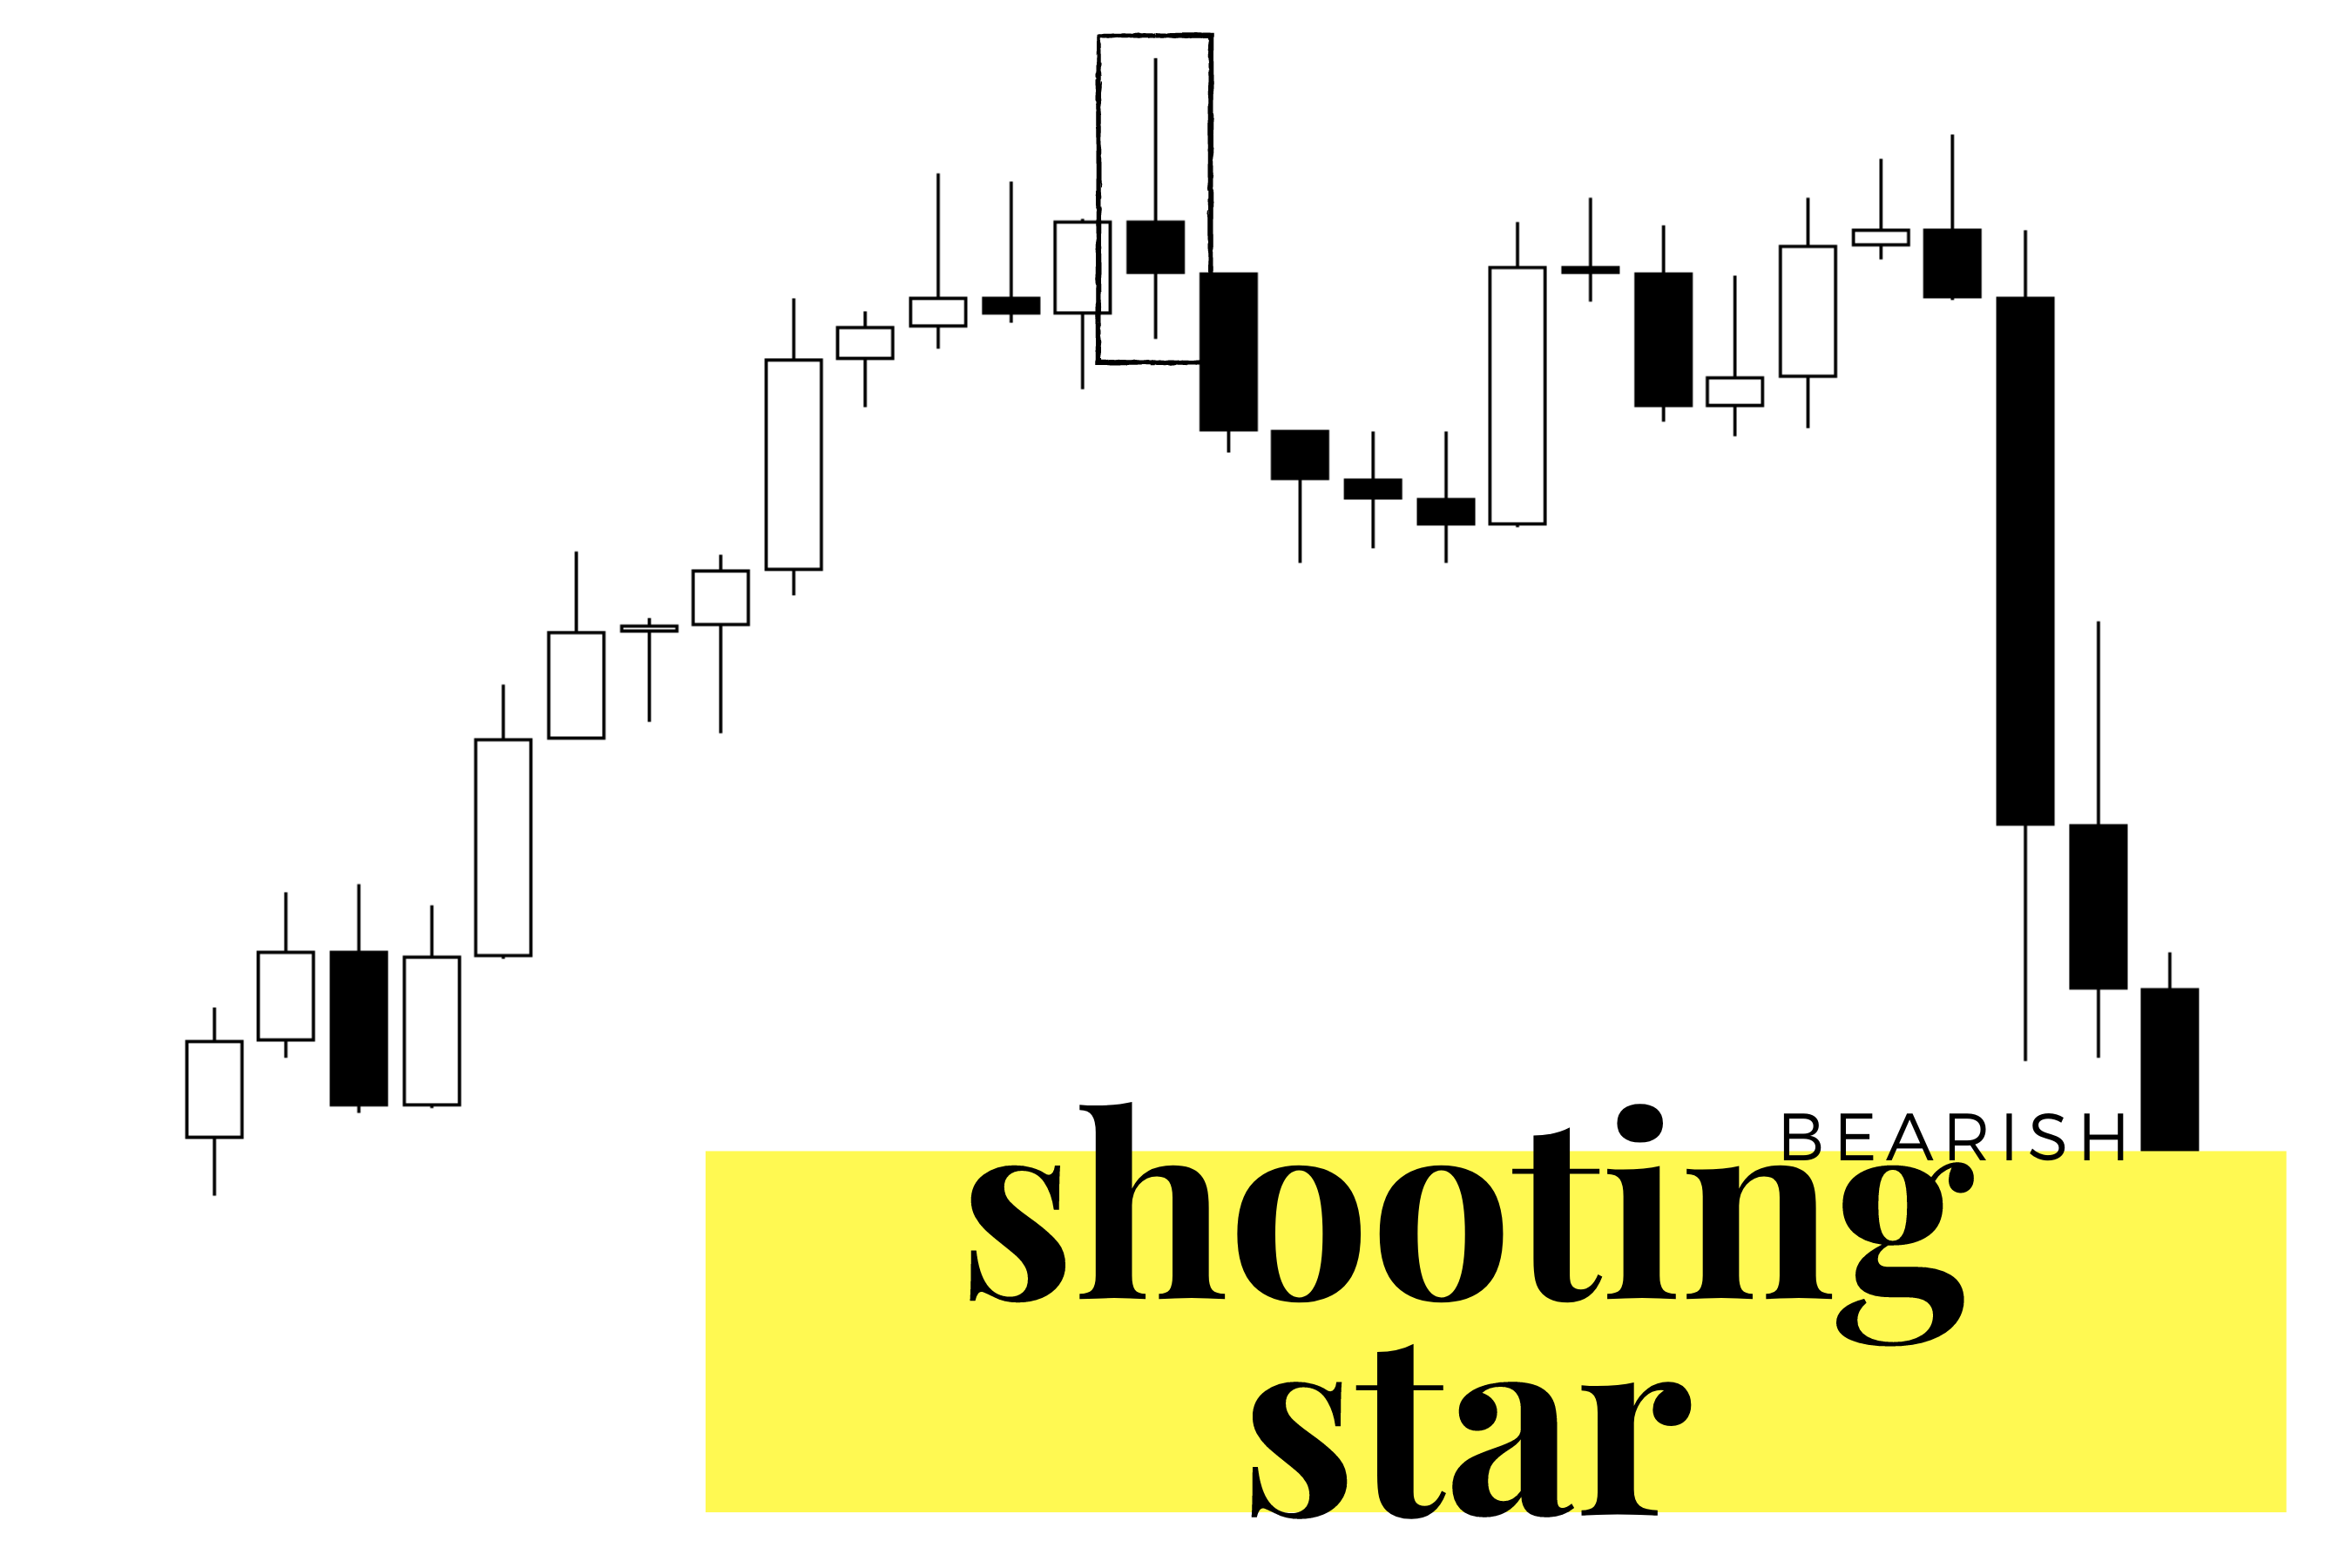
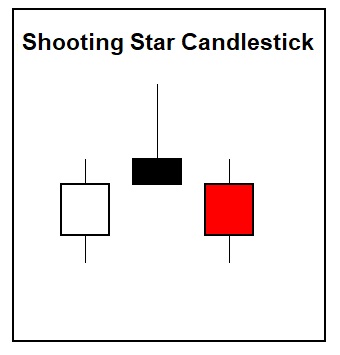
A shooting star candle or pin bar reversal is a bearish candlestick pattern appearing during an uptrend on a chart. A shooting star tends to have long upper wicks and almost no lower wicks, along with a candle body that is usually small. A shooting star usually happens when a price opens and then goes much higher intra-day but reverses and closes lower near the opening price or lower. The larger the upper wick is in relation to the candle body, the more bearish it is, as it has created new overhead resistance and shows a rejection by buyers at higher prices.
- A shooting star is a bearish signal and could indicate the end of an uptrend and the increased possibility of a downtrend beginning.
- It’s bearish because it shows the rejection of higher prices and the beginning of selling pressure.
- If the next candle after the shooting star has a lower high and lower low, it increases the probability of the end of the uptrend.
- Price closing back over the high of the day of a shooting star invalidates the bearish signal.
- Shooting star candles are best used in confluence with other signals like overbought readings, key moving averages, or resistance zones to put the pattern inside the context of the overall chart.
What Does the Shooting Star Tell You?
The shooting star candlestick pattern tells a trader or investor that there is a high probability that price action has reached the top of the chart, at least in the short term. This signals that the odds have shifted to reveal buyers have become exhausted at higher prices, and sellers overwhelmed them to take price action back to where it started or lower. While buyers and sellers are always even in each transaction, the price action reveals the actual supply and demand metrics at different levels. The shooting star shows an overwhelming supply at higher prices and a lack of demand by buyers to keep pushing a chart higher. The shooting star shows you bearish sentiment has set in on a chart previously in an uptrend.
What Makes A Shooting Star Bearish?
- A failure of the chart to hold new high prices.
- A reversal back to the opening of the candle.
- A large upper wick.
- The candle is usually black or red, showing a lower close than the open.
Example of How to Use the Shooting Star

A shooting star candlestick pattern can be used as a short-sell signal on a chart you are bearish on. It confirms that the chart may have started a reversal as it failed to go higher in price and reversed lower. A short-sell has good odds of success on entry on the next bearish candle after the shooting star candle for confirmation that price is following through to lower prices. A stop loss can be set on a close above the shooting star, with a profit target set at previous support or resistance levels on the chart or the 50 RSI. A trailing stop could be moved to each previous candle high as an end-of-candle stop to lock in profits if there is a sizable reversal to the upside.
How To Spot Resistance With Shooting Star Patterns
The shooting star candlestick pattern is best used in confluence with other signals like overbought readings, key moving averages, or resistance zones. They are most meaningful and accurate when they occur at overbought areas like the 70 RSI or the 3rd deviation from the 20-day moving average. A shooting star that forms at an overhead Fibonacci level or key moving average can also show a bearish confluence. A shooting star that occurs at higher prices while the RSI is at a lower level than the previous high can show a bearish divergence between the price and the indicator.
Using The Shooting Star To Spot Sell Signals
A shooting star can signal highly accurately that it’s time to lock in profits on any long positions during a strong uptrend. The risk/reward ratio is no longer favorable when a chart reverses strongly after an extended uptrend. The shooting star can be both a short signal for new positions or an exit signal for current long positions.
Limitations of the Shooting Star
The shooting star candlestick pattern isn’t predictive. It just shows there are greater odds of one thing happening than another in the future based on the current price action behavior on the chart. It can create an edge by showing objective bearish price action and not just a subjective opinion about what should happen next. It’s a momentum reversal signal, not a guaranteed profit. Stop losses must still be used on all trades to limit risk exposure.
The Difference Between the Shooting Star and the Inverted Hammer

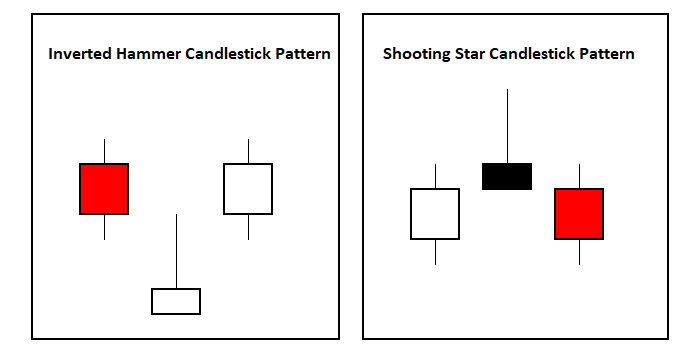
A shooting star looks like an inverted hammer, but it’s bearish in the context of an uptrend. The shooting star candle has a lower close than the open and is commonly a red or black candle.
If an inverted hammer occurs near the lows on a chart, it can signal a bullish reversal. A bullish inverted hammer shows buyers bid up price action after rejecting new lower lows. The inverted hammer shows dip buyers present in a downtrend and that they held prices up until the close higher than the candle lows. This is a stealthy signal of demand inside a downtrend. The long wick of the inverted candle often pierces inside the previous candle range on the chart. If the next candle on the chart after the inverted candle is bullish, it confirms the bullish signal showing that at least a short-term low in prices might be in, and higher prices ahead become the new probability.
Key takeaways
The shooting star candlestick is one of the strongest bearish candlestick signals in technical analysis showing traders a high probability that it’s time to lock in profits in long positions and that it may even be a good time to go short on the chart where it occurs.
