The RSI indicator strategy uses the Relative Strength Index to make buy and sell decisions on a chart based on oversold and overbought reading versus the price of a stock or security.
What Does the Relative Strength Index (RSI) Measure?
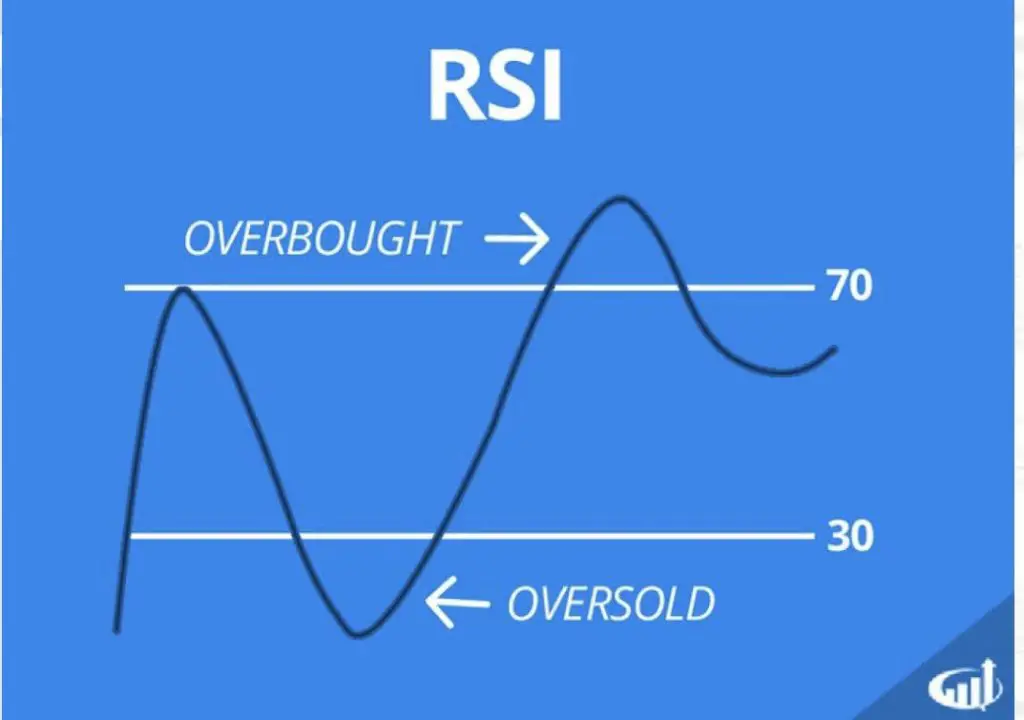
The Relative Strength Index (RSI) is a technical indicator that traders use to quantify the price momentum on a chart. The RSI is used to measure the magnitude and speed of price moving in one direction on a chart. RSI readings are on a scale from 0 to 100 but over 90% of the readings will usually fall inside the 30-70 range on most charts. RSI readings below 30 indicate that the stock is likely oversold and RSI readings above 70 indicate that the odds are a chart is overbought. Oversold simple signals that price likely went down too far and too fast and overbought signals a chart has gone up too far and too fast. The RSI is primarily used as a reversal signal at chart extremes. The RSI is usually set on a chart below the price action to see how it correlates to price movement. The common default settings on a chart for the RSI is 14 periods.

What Is an RSI Buy Signal?
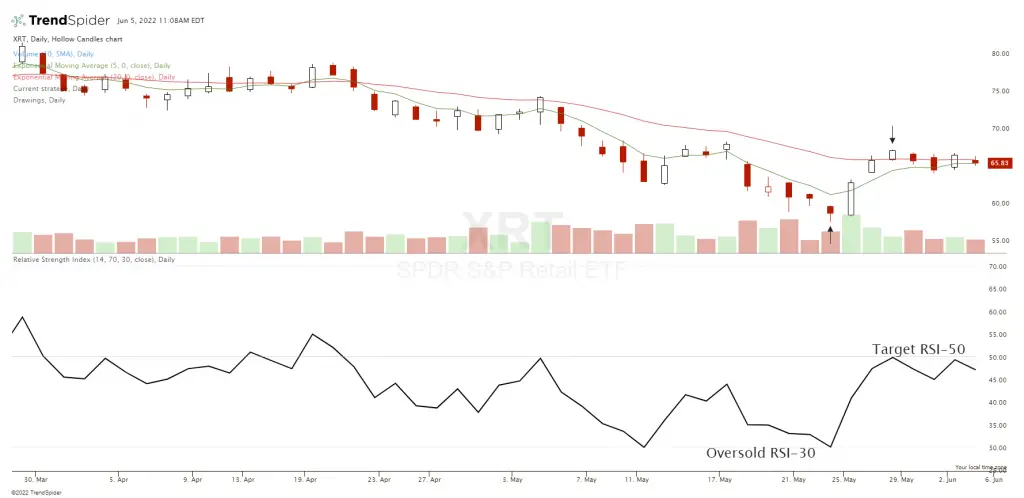
Popular RSI buy signals are when a chart reads RSI-30, price bounces back higher after reaching the RSI-30 zone, or price dropping below but breaking back over the RSI-30 reading on the chart. All these signals show that the chart is likely oversold in its time frame and the odds are it at least bounces back for an upswing in the short term.
The RSI dip buy works best on charts in primary uptrends with an upward bias. During downtrends the RSI can just continue to go lower and lower. It’s usually not a high probability of success to hold long positions under the 30 RSI reading as it shows a lack of buying support.
What Is an RSI Sell Signal?
Popular RSI sell and sell short signals are when a chart reads RSI-70, price falls back lower after reaching the RSI-70 zone, or price rising above but breaking back under the RSI-70 reading on the chart. All these signals show that the chart is likely overbought in its time frame and the odds are it at least drops back lower for a downswing in the short term.
The RSI short signal can work on charts after long term uptrends or the first big rally in a downtrend. During parabolic uptrends the RSI can just continue to go higher and higher so stop losses must always be used if price breaks back over the RSI-70. It’s usually not a high probability of success to hold short positions over the 70 RSI reading as it shows incredible buying pressure breaking through that level.
The RSI-70 zone is usually a good place to lock in long position profits as the risk/reward ratio no longer favors much higher prices in the short term. The RSI-30 zone is usually a good place to lock in short position profits as the odds of going much lower are slim.

What does RSI 50 indicate?
The RSI-50 can signal that a chart is range bound and going sideways will little momentum in either direction if that reading holds over time. The RSI-50 can also be considered an overhead profit target for long positions entered at the RSI-30 zone or a lower profit target for short position opened in the RSI-70 zone. Wide trading ranges can also be bounded in the RSI-30 to 70 range or the RSI-50 to 70 range.
The RSI indicator is not a magic predictor of future price action it’s a technical tool for creating a strategy with a good risk/reward ratio and high probability signals for managing trade entries and exits.
You can learn about more technical indicator signals in my book The Ultimate Guide to Technical Analysis available on Amazon.
