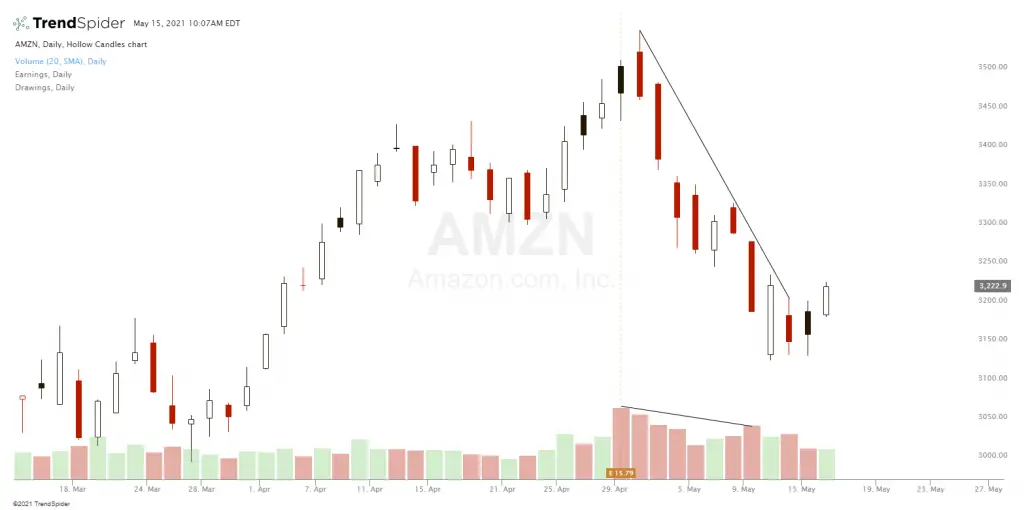
Volume is like votes on the price of a stock as each trade is an agreement between a buyer and a seller to exchange shares. The volume is the amount of trades that occur during each time period on a chart. Technical traders look for correlations between price action trends and the increasing and decreasing of volume.
Volume is the quantity of stock shares that trades between buyers and sellers over a period of time on a chart. Volume can be measured on any time frame from the one minute, to the hour, or on the daily or weekly chart. Stock trading volume on the daily chart would be the number of shares traded from the open of the day to the close of the day. The volume of trading and the changes to the amount of volume over time, can be important technical inputs for traders.
Liquidity can be the most important fundamental for a chart. Without volume making a stock liquid most other technical analysis doesn’t matter. Volume is needed both from buyers and sellers to keep the bid/ask spreads tight for good order fills. A trader wants to focus on active names so they can have speed in the fills for their buy and sell orders. The farther a trader moves from the most active stocks and the major exchanges the slower and wider their fills will become.
Volume is what creates technical levels as buyers wait at support levels to buy and sellers wait to distribute at resistance levels on a chart. Downtrends occur when there is a lack of buyers at key price levels so sellers have to go searching lower to exit. Uptrends occur when there is a lack of sellers at higher price levels so buyers have to go searching higher to find sellers willing to exit their shares. Don’t get confused, buyers and sellers are always equal in every trade transaction on a chart, but it is the price that changes on where they agree to let a stock change ownership.
Volume is one of the most important technical indicators for analysis because it is used to quantify the strength of a price move. The higher the volume during a swing or trend in price action, the more valid the move is. The lower the volume during a swing or trend in price action, the less valid the move is.
Volume can be an indicator of accumulation or distribution on a chart. Uptrends should see rising or steady volume on higher prices to validate the trend with buying pressure pushing prices higher showing accumulation and buying and holding for the stock increasing. Downtrends should see rising volume on lower prices to validate the trend with selling pressure pushing prices lower showing distribution and people exiting a stock. Breakouts from a price range have more validation and meaning when they occur on a higher than average volume.
Volume is primarily used to confirm a price move in technical analysis. Traders look for a confluence between higher volume and higher prices and also higher volume and lower prices. Bearish divergences between volume and price action occur when a stock chart makes a higher high in prices on lower than usual volume. Bullish divergences between volume and price action occur when a stock chart makes a lower low in prices on lower than usual volume. Both these divergences could signal a reversal in price action from the current trend.
A large reversal in price action from the current trend along with a large increase in volume can signal a high probability that the current trend has ended and the next move could be in the opposite direction or at least sideways. Many times a reversal in a trend will show a large reversal candle on a chart that ends in the opposite direction of the current trend along with a large spike in volume. On a chart reversal the volume can start with large spike then the volume an decrease as the trend reversal plays out.
On days when price ends higher volume can be marked green and considered bullish. On days when price ends lower volume can be marked red and considered bearish. This classification means the volume on that day was primarily one sentiment even though all the trades were not necessarily bullish or bearish just that the move was primarily in one direction.
Volume is the fuel for price moves and can be a warning sign of the possible failure of a move when a trend in volume doesn’t confirm the trend in price action.
