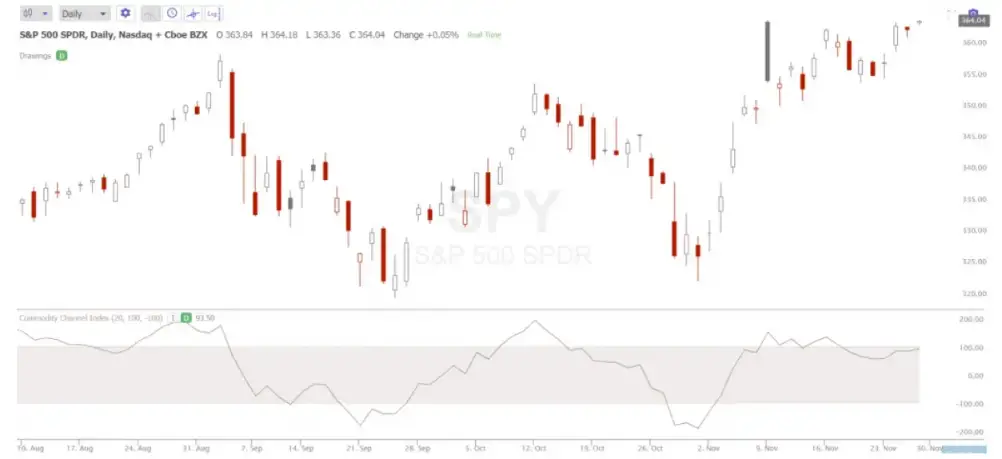
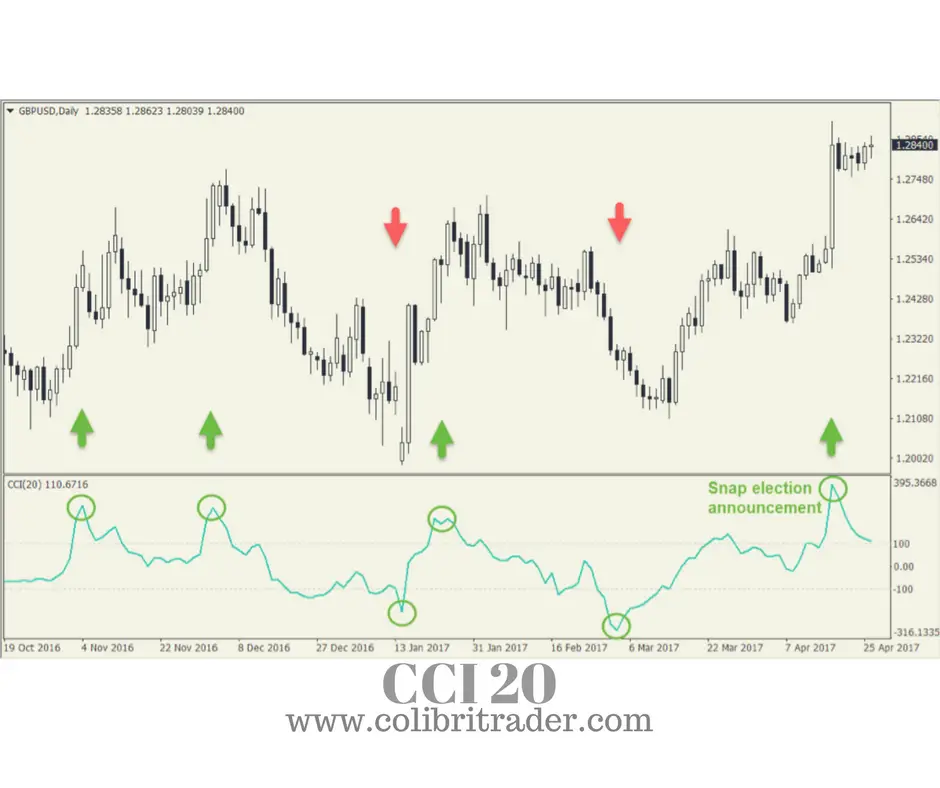
The CCI indicator (commodity channel index) is an oscillator originally created in 1980 by Donald Lambert . He developed CCI originally to identify and quantify cyclical moves in commodity charts, but this technical indicator has also been used on stock indexes, exchange traded funds, stocks and charts of other markets.
It can be used as a diverse indicator to signal a new price trend on a chart or be a warning sign of overbought or oversold conditions. It can signal the beginning of a possible new trend on a chart or that a current trend has went too far and too fast and the odds are that it could reverse soon.
The CCI indicator measures the current price in relation to the average price over a specified time frame. CCI has a high reading when prices are above their average, and has a low reading when current prices are below their average for the time frame setting. CCI can be used to quantify overbought and oversold levels through the level of its current reading on a chart.
The number of CCI periods set on a chart is used to calculate the simple moving average and mean deviation. Lambert set the constant at .015 so 70% to 80% of CCI values would be in the -100 to +100 range. Where a sample percentage of the CCI indicator reading falls within its ranges is determined on the time period examined. A shorter period will have more volatility and a smaller percentage of values in the +100 to -100 range. A longer period will have a higher percentage of +100 to -100 reading values.
High positive CCI readings can signal that prices are far above their average price at a specific time and shows price strength. A low negative CCI reading can signal that prices are far below their average price and shows price weakness.
The CCI indicator can be used as a trend indicator. CCI moves above +100 signaling momentum and potential uptrending price action. CCI indicator moves below -100 signal falling price momentum and potential downtrending price action.
Technical analysts can use the CCI indicator as a leading indicator by seeing if extreme overbought or oversold readings could be signaling a high probability of a mean reversion in price. Bullish and bearish divergences are also used to observe slowing momentum signaling possible trend reversals when CCI and price diverge and price makes a new high but CCI doesn’t make a new high reading or price makes a new low but CCI doesn’t make a new low reading.
The CCI indicator can give a trader context to the momentum and duration of a price move in relation to the average price in the chart’s time frame.

