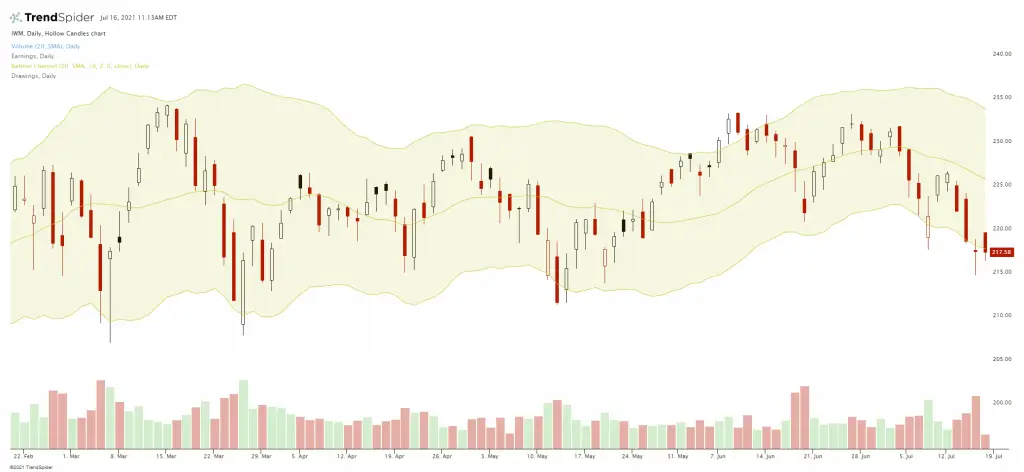
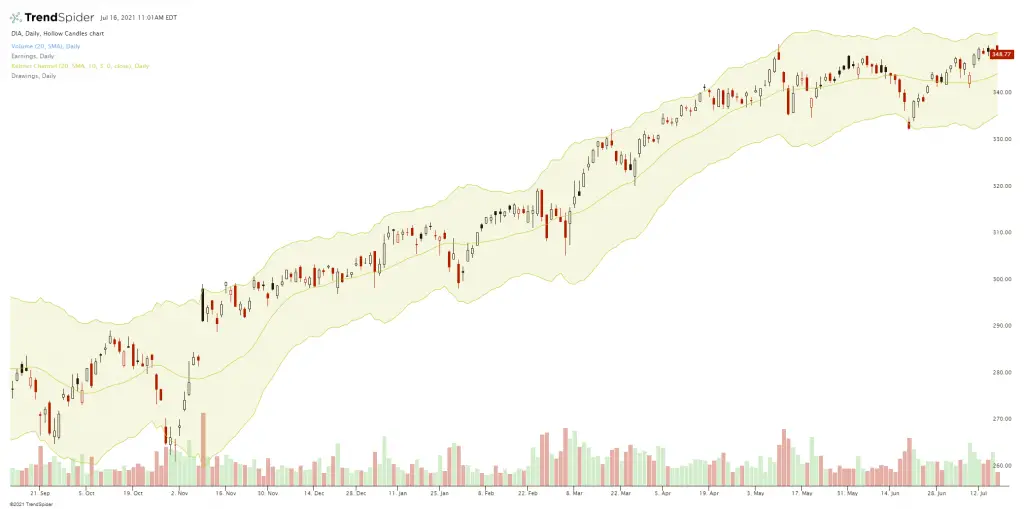
Keltner Channels are a technical indicator shown visually as envelopes expressing the deviation in Average True Range on a chart both above and below an exponential moving average. It is very similar in principle to Bollinger Bands, which use standard deviations from a moving average to quantify the bands. The difference is that Keltner Channels use ATR versus standard deviations to quantify the distance of price from the moving average.
Keltner channels default setting is two ATRs both above and below the 20-day EMA. The direction of the exponential moving average quantifies trend direction as inclining is up and declining is down while the ATR channel width express the volatility on the chart. Keltner Channels can both identify the overall trend on the chart and also show areas with a high probability of reversal. Channel breakouts over or under 2 ATRs can at times signal a strong trend, however breakouts from 3 ATR channels fail the majority of the time. Keltner Channels identify overbought and oversold levels at the upper and lower boundaries when a market is going sideways inside a range.
Keltner Channels are calculated be selecting the time frame length for the exponential moving average and also choosing the time periods for the Average True Range and the multiplier used for the Average True Range.
The most popular default setting is:
The 20-day exponential moving average as the middle line.
20-day EMA + (2 x ATR(10)) as the upper channel line.
20-day EMA – (2 x ATR(10)) as the lower channel line.
Most trading platforms fill the space between the upper and lower channel lines with a colored cloud background to easily see the range.

Chart Courtesy of TrendSpider.com
I prefer the 3 ATR setting for the channel lines as I have found it to capture much more of the price action moves inside this wider channel boundary than the default 2 ATRs.
The 20-day exponential moving average as the middle line.
20-day EMA + (3 x ATR(10)) as the upper channel line.
20-day EMA – (3 x ATR(10)) as the lower channel line.

This is the modern version of Keltner channels much different than the original dynamics. Linda Bradford Raschke created the newer version of Keltner Channels back in the 1980s. This new version changed to use a volatility based indicator, Average True Range (ATR) for channel width.[1]