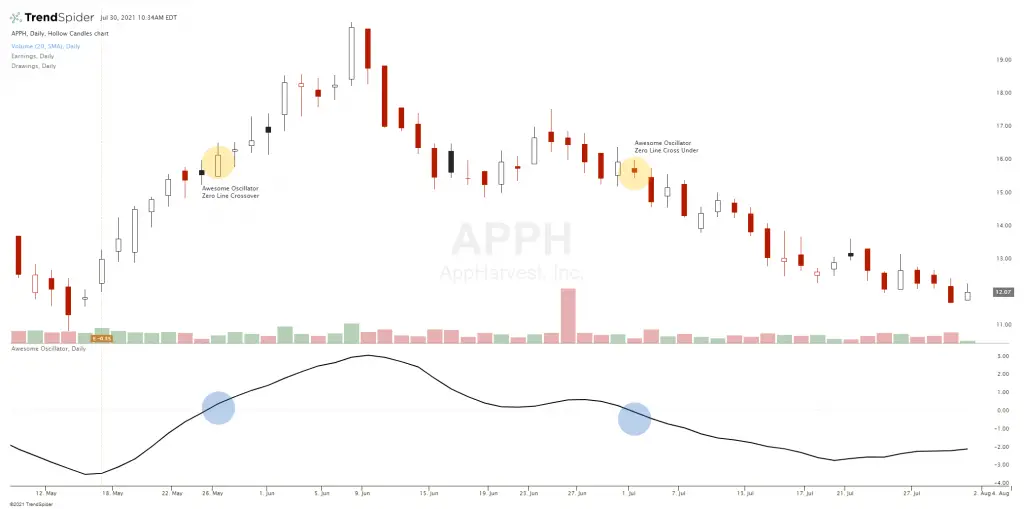
Awesome Oscillator was developed by Bill Williams. The Awesome Oscillator (AO) is a non-limiting oscillator used in technical analysis. It quantifies the weakness or the strength of price on a chart. The Awesome Oscillator measures the price momentum in one direction, confirms trends and can also show when momentum is waning and signal the potential for trend reversals. It works by comparing current price momentum with longer-term price momentum on the chart.
The formula used to create the Awesome Oscillator compares two moving averages, one that is short-term and one that is more long-term. The moving averages in this indicator are calculated by adding the highest price of the day to the lowest price and dividing by two to get the mid-point price. This different kind of moving average is used instead of the using closing price for the average calculation. Using the middle point of price action allows the indicator to filter the trading activity of an entire day. If volatility was high during the day then the middle point would be much different than the closing price. Moving averages using the closing price of the day don’t reflect the full trading range of price if there was a major reversal. The common default value settings used for the indicator are 5 periods for the fast and 34 periods for the slow moving averages.
Fast Period = (Simple Moving Average (Highest Price + Lowest Price)/2, x periods)
Slow Period = (Simple Moving Average (Highest Price + Lowest Price)/2, x periods)
Awesome Oscillator = Fast Period – Slow Period
On charting platforms the Awesome Oscillator indicator can be shown as a histogram or a fluctuating line.
The Awesome Oscillator moves between positive and negative readings around its middle zero line. The primary signal for this indicator is a cross above or below the zero line. A reading that is positive shows that the fast period is higher than the slow period and conversely, a negative reading shows that the fast period is lower than the slow period.
The Awesome Oscillator is bullish when it goes from negative to positive territory. It is bearish when the awesome oscillator indicator goes from positive to negative territory. This can work out as valid short and long signals on charts with strong trends or big swings in price action but can give a lot of false signals in choppy markets with wide volatile price ranges. When the Awesome Oscillator entry signal works out as a winning trade other technical indicators are best used as an exit signal to lock in profits, like 30/70 RSI or 3 ATR Keltner Channels.
It is most useful to confirm other trend trading and momentum signals in technical analysis by being an additional filter of confluence for the direction of a move.

