Standard deviations are used to measure current price action in relation to the average price of a chosen time frame. The assumption in the use of a standard deviation is that over the long term historical prices are distributed inside a bell curve. Although at times there are ‘fat tales’ or ‘black swans’ in prices versus historically normal distribution the majority of the time prices do stay within a range of extensions from an average. Technical indicators can still create value to look at current price action inside the context of normal distribution parameters to measure the magnitude and significance of the extension of price from a value zone and the probabilities of a reversion.
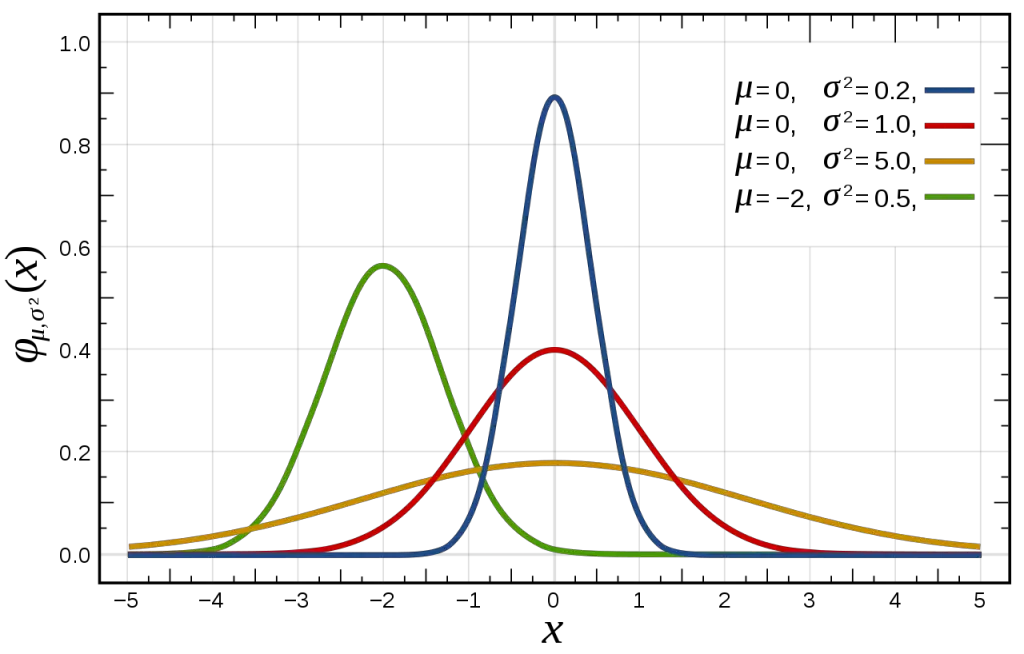
What the normal distribution inside of a Bell Curve looks life:

If price changes are usually distributed within the parameters of a classic bell curve then approximately 68% of price action will be within one standard deviation, approximately 95% will be contained within two standard deviations, and approximately 99.7% will happen inside three. With these parameters of deviations traders and investors can see the magnitude of a price movement away from the normal value zone. A price move bigger than one standard deviation shows that strength or weakness is greater than the average in the direction of the move and trend.
Fat-tail events are those completely outside the normal bell curve of possibility until they happen, these are the high risk events like Black Monday 1987 or the 2008 financial crisis that moved prices to levels not thought possible even to zero in some cases. In contrast, a normal distribution event that causes prices to deviate from the average by over five or more standard deviations is called a ‘5-sigma events’ and are possible inside a wider standard bell curve of normal distributions but have a very low probability of happening. 5- sigma normal distribution events are very rare but much more probable than fat tail events greater than 5 standard deviations from the mean and far outside even a wider 5 sigma bell curve.
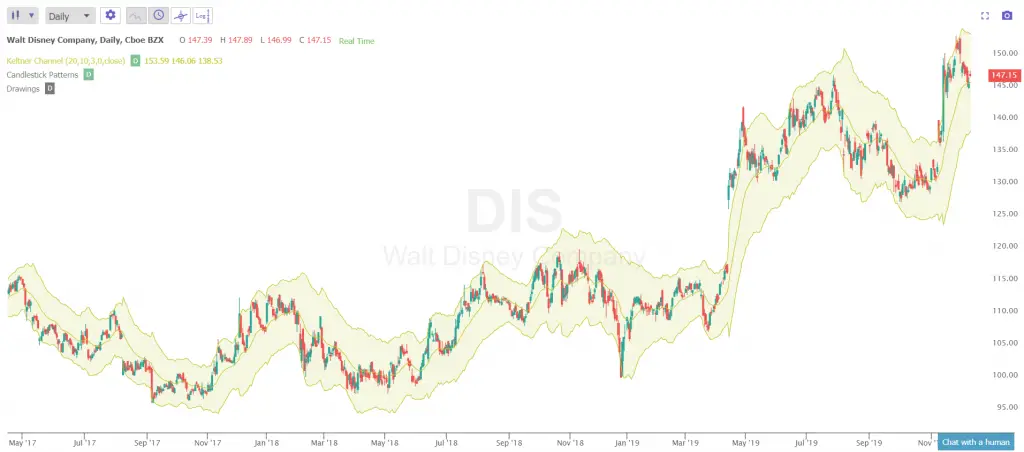
Bollinger Bands and Keltner Channels are two types of tools for measuring standard deviations with ‘envelopes’ plotted on a chart. Bollinger Bands and Keltner channels are technical indicators that create price envelopes that show visual upper and lower standard deviations from an average. They use two parameters, both period and standard deviations and these are set at default values of 20 for the period with 2 as the standard deviations, but these can be adjusted for time frame or a wider or smaller deviation parameter. The indicator bands adjust to volatility swings in the underlying price by expanding and contracting.
Both of these reversion to the mean trading tools help show if prices are high or low on a relative basis in comparison to an average of prices. These indicators are not stand alone signals but need a confluence with other technical tools to confirm potential signals of whether a chart is overbought or oversold or trending strongly in one direction.

Example of price action in relation to 3 standard deviations on the $DIS chart.
Chart courtesy of TrendSpider.com