The problem with the Turtle trading strategy is that during breakouts that reverse you can be a dead turtle. The Turtle Soup trading strategy was created by legendary trader and Market Wizard Linda Bradford-Raschke. This is an inverse strategy to the legendary Turtle traders trend following system that they used to make millions in trending markets.
Linda Bradford-Raschke shared the Turtle Soup trading strategy in her book “Street Smarts: High Probability Short-Term Trading Strategies.” Linda Raschke reversed the trend following edge of this trading strategy and created a short-term reversion to the mean swing trading method. So when the Turtle Traders bought or sold a breakout and it whipsawed against them and they lost money, she would make money be betting on a breakout failure and reversal.
With momentum and trend trading, a breakout can fail and price can whipsaw back into the trading range. Most charts will breakout into trends eventually over the long term but this strategy plays the whip saws. The Turtle Soup trading strategy plays the reversions to the mean and signals entries for the times when the price breakout fails.
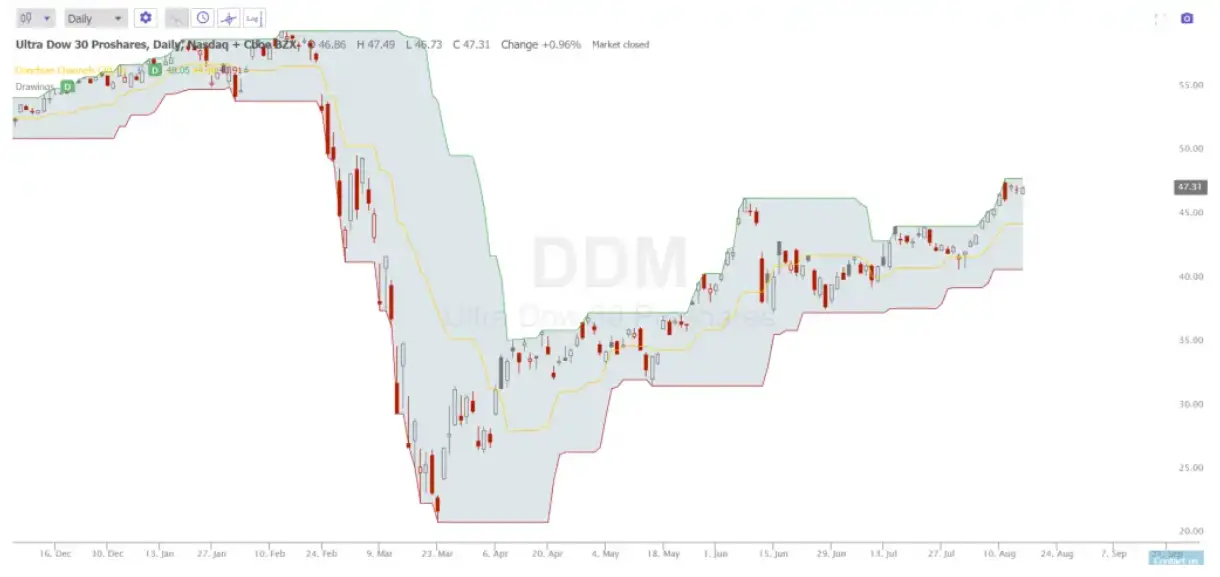
The Donchian channel is a technical trading indicator that tracks the high and low over a number of periods. This chart sets it at 20 days as an example. The Donchian channel is a great visual tool for tracking Turtle Soup signals. (The real time signals for the chart differ in real time intraday versus how they work out by the end of the day on the historical chart).

Chart courtesy of TrendSpider.com
Buy signals:
- The chart breaks to a new 20 day low in price. The lower that price falls beneath that previous low the better the risk/reward for this signal.
- The previous 20 day low in price must have happened a minimum of four days ago on the daily chart. A low of today versus yesterday is too soon, at least four days need to go by between new 20 day lows to be valid.
- An entry should be approximately 5-10 cents above the previous 20 day low. This confirms that price reversed instead of trending lower. The entry signal is only valid for one day.
- A stop loss after an entry signal should be set just a couple of cents below the low of the day of entry.
Short selling signals:
- The chart breaks to a new 20 day high in price. The higher that price rises above the previous high the better the risk/reward for this signal.
- The previous 20 day high must have happened a minimum of four days ago on the daily chart. A high of today versus yesterday is too soon, at least four days need to go by between new 20 day highs to be valid.
- A short selling entry should be approximately 5-10 cents below the previous 20 day high. This confirms that price reversed instead of trending higher. The short entry signal is only valid for one day.
- A stop loss after an entry signal should be set just a couple of cents above the high of the day of entry.
Other system management rules:
- If a trade hits the stop loss on the day of entry or the next day, a stop order to buy or sell for a new entry can be placed at the same price as the last entry signal.
- Trailing stops of 1R can be used to lock in profits if the trade goes in your favor to make the winning trades as big as possible.
This is an example of a simple mean reversion trading strategy that reverses the Turtle Trading strategy and performs well in range bound markets when they revert to the mean instead of trending in the direction of the breakout.
This article is for informational purposes only and is not investment advice.
