Portfolio backtesting is the process of using historical price data to analyze and backtest the returns of a group of stocks, exchange traded funds, or mutual funds in the past. A complete portfolio backtest of your watchlist can visualize the risk of correlations, optimum percentage of capital exposures, drawdowns, and potential for diversification to hedge.
A good portfolio backtesting tool allows a trader or investor to construct one or more portfolios and track its annual returns in comparison to a similar benchmark. Good backtesting software will show you the equity curve of your portfolio with a visual graph.
- You need a stock, ETF, or mutual fund screen to filter for portfolio selection based on your own parameters.
- You must decide on the allocation weight you will give to each watchlist item for allocation of capital.
- You also must decide whether to stick with that weighting as the maximum capital to allocate or if you will increase allocations based on signals.
- A trader can use signals to be long positions only when the trend is bullish.
- Investors can take capital allocations to cash when a chart is bearish.
- An investor can stay all in and rebalance their portfolio quarterly or annually.
- Portfolio components can be taken out and new ones added.
- A diversified portfolio lowers the risk of large drawdowns.
- A highly correlated portfolio can lead to huge returns when the sector is in favor.
- An ideal portfolio will outperform its benchmark in both returns and drawdowns over the long term.
- Approximately 80% of stock market returns come from 20% of stocks over the long term, focus on finding those.
- Research shows owning at least 12–18 stocks provides enough diversification, there are diminishing returns from adding more.
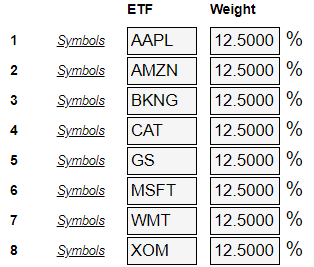
The below data shows a simple stock portfolio of eight high alpha stocks with 12.5% capital allocation to each. This portfolio backtest is long a stock as long as its price is over its 200-day moving average on the last day of the month. If the stock closes below its 200-day moving average on the last day of the month it takes that 12.5% of portfolio capital to cash until it closes back over the 200-day moving average on a future last day of the month.
Backtest data and charts courtesy of @ETFreplay ETFreplay.com.


Here are the stocks in the portfolio backtest. 
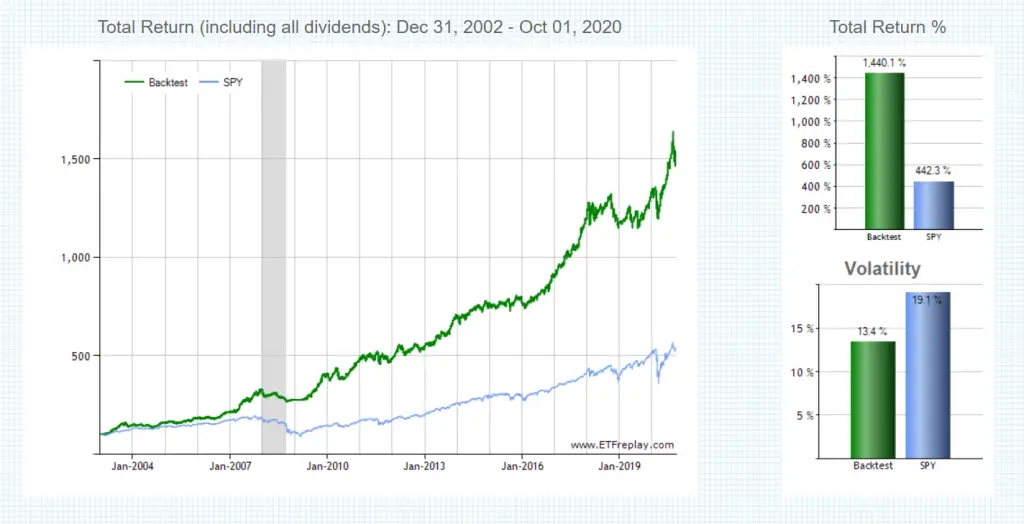
The below graph shows the portfolio backtest returns visually compared to the SPY ETF, portfolio total return% versus the SPY%, and also the portfolio volatility versus SPY.

Portfolio backtesting data courtesy of ETFreplay.com
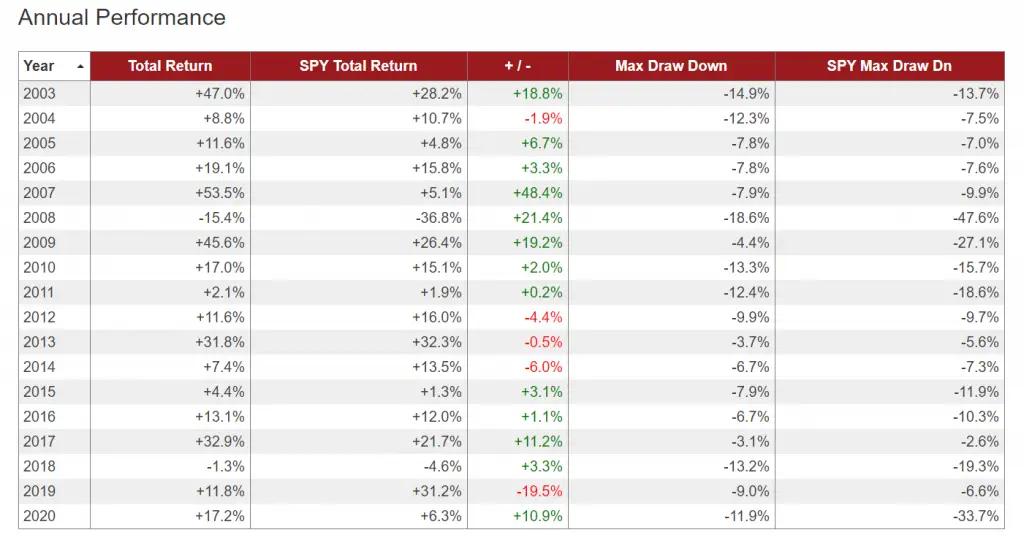
Here are other portfolio performance statistics versus the SPY ETF.

 Portfolio backtesting data courtesy of ETFreplay.com
While the portfolio backtest does not beat SPY returns every year it does outperform SPY buy and hold in both returns and drawdowns over the long term data. This is one example of how to use a portfolio backtest to analyze a signals performance on a watchlist of stocks inside a systematic process.
For a shortcut and time saver on learning the basic principles of backtesting, check out my Backtesting 101 eCourse here.