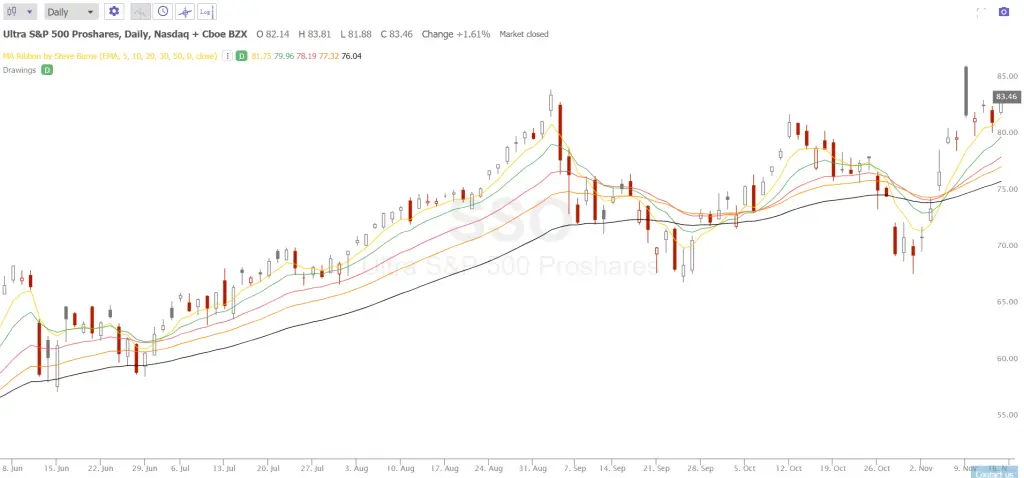
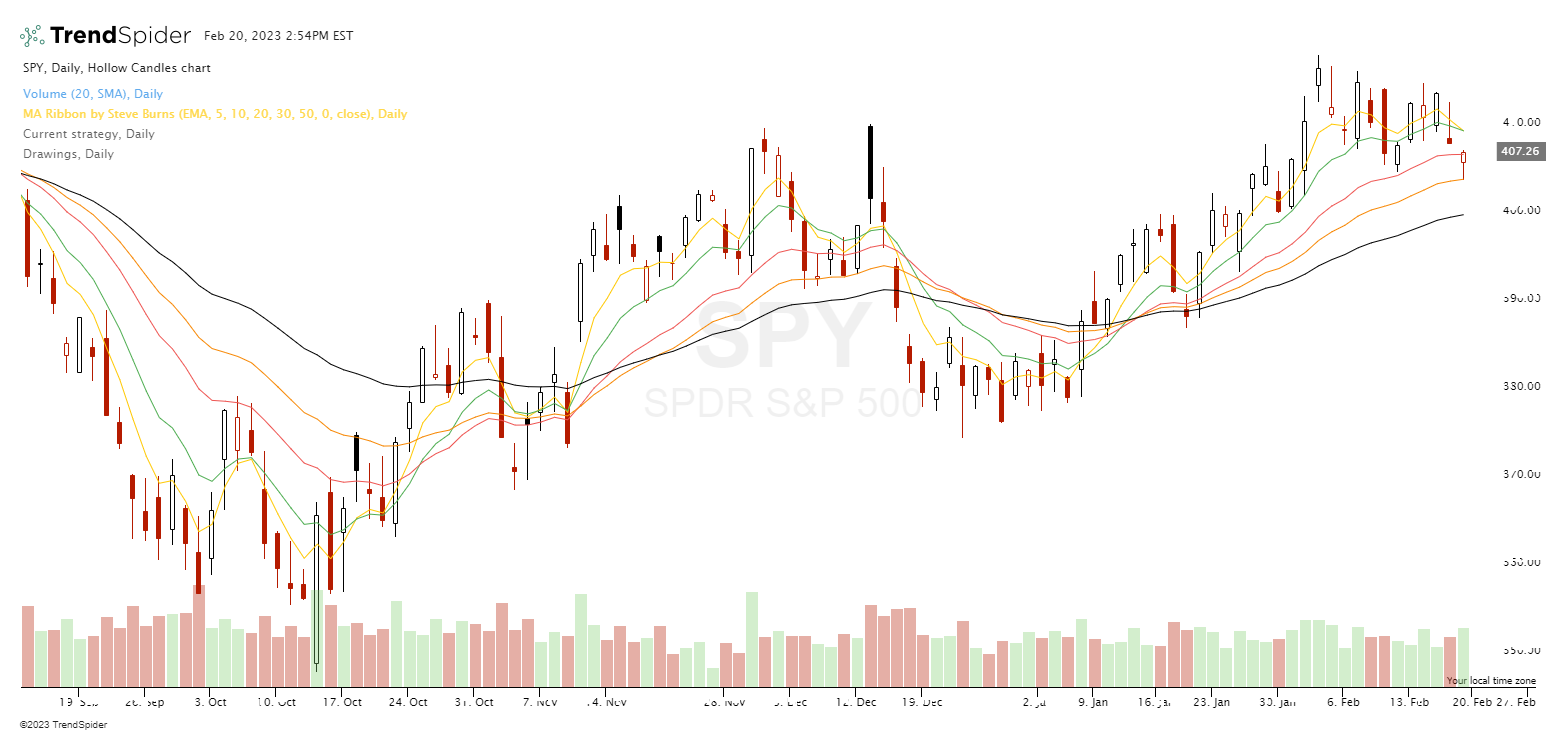
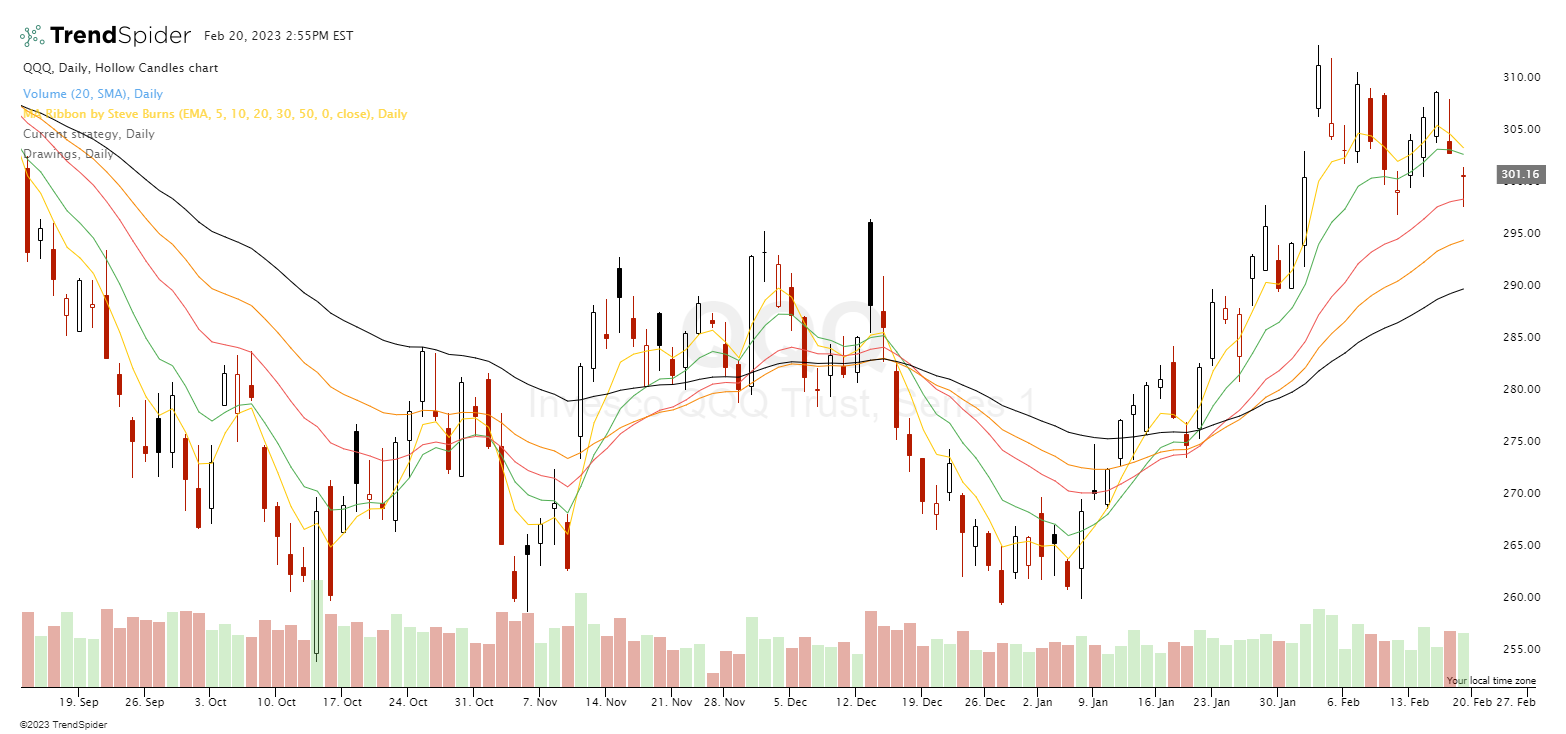
A moving average ribbon indicator is a set of multiple moving averages of different timeframes placed on a chart all at one time. A ribbon instantly shows price action in relation to all the different moving averages.
The Steve Burns Moving Average Ribbon is created with five different length moving averages. Exponential moving averages are used in my ribbon as they react and change to price action quicker than simple moving averages and they tend to backtest better on most charts.
My Ribbon is created from these key moving averages.
The 5 day exponential moving average shows momentum.
The 10 day exponential moving average shows the short term trend.
The 20 day exponential moving average shows reversion to the mean.
The 30 day exponential moving average is a price swing filter.
The 50 day exponential moving average can show pullbacks in an uptrend.

Here are 12 technical moving average ribbon signals:
- Price trading above all moving averages is bullish.
- When all shorter time frame moving averages are above longer term moving averages in order: 5 is over the 10, and the 10 is over the 20, etc. this shows an uptrend is in progress.
- Price trading below all moving averages is bearish.
- All shorter time frame moving averages are below longer term moving averages in order: 5 is under the 10, and the 10 is under the 20, etc. this shows a downtrend is in progress.
- The 5 day / 20 day ema crossover inside the ribbon is a short term bullish momentum signal.
- 5 day / 30 day ema crossover inside the ribbon is an intermediate term bullish momentum signal.
- 10 day / 30 day ema crossover inside the ribbon is a bullish swing trading signal.
- 10 day / 50 day ema crossover inside the ribbon is a bullish trend trading signal.
- When the moving averages converge and are close to equal and going sideways it is a signal that price is range bound.
- Price action above both the 5 day and 10 day ema is bullish.
- Price action below both the 30 day and 50 day ema is bearish.
- Price tends to revert back to the 20 day ema often as this is the value zone.

Charts courtesy of TrendSpider.com.
The new technical indicator the “MA Ribbon by Steve Burns” is available now on the TrendSpider.com charting and backtesting platform and can be a new trend filtering tool to add to your own technical analysis.
For more information about trading with moving averages you can check out the new second edition of my book “Moving Averages 101.”
