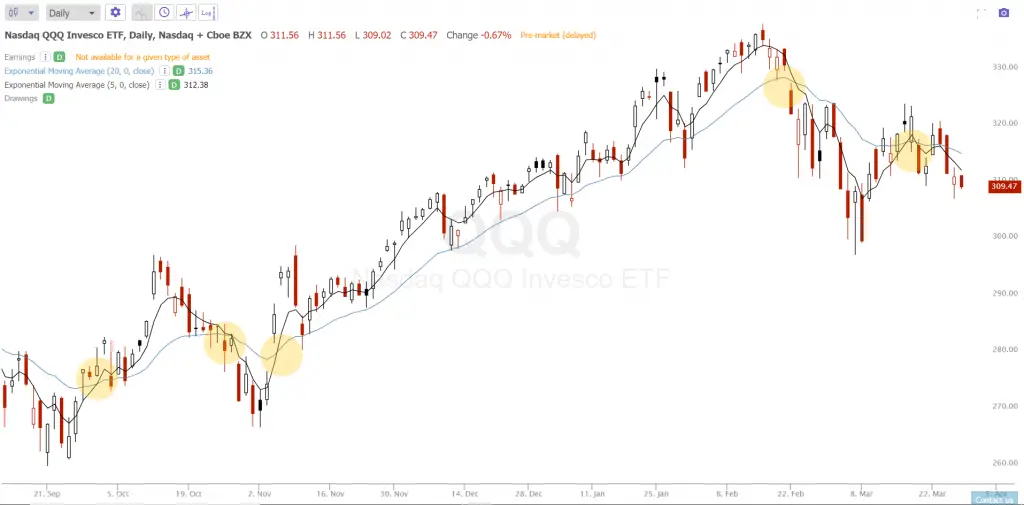
What is the best moving average crossover for swing trading? My favorite moving average crossover for swing trading that I have also confirmed through backtesting on the momentum names on my watchlist is the 5 day exponential moving average / 20 day exponential moving average crossover on the daily chart.
I call this bullish crossover the flying eagle cross. I call the 5 day / 20 day ema cross under the wounded duck cross. The 5/20 day ema crossover signal is a short term signal for entering and capturing quick swings in price action then exiting when the 5/20 day ema crosses back under.
So to summarize, the 5 day ema crossing and also closing over the 20 day ema on the daily chart is the buy signal. The 5 day ema crossing and also closing under the 20 day ema on the daily chart is the sell signal.
Many times it is a robust signal for getting in and getting out of a swing trade across many charts that show momentum and trends historically in price action. This moving average has also performed well overall on IPOs early in their charts as the crossover signals the up swings and up trends in price action. The cross under also signals down swings and downtrends in price.

This is many times a short term swing trading signal that captures both swings to the upside but can also capture short term and even longer term trends that keep going. This signal backtests well on many of the best performing stock charts, metals, and Bitcoin. It is best used as a long signal and goes to cash when there is a bearish cross under. This signal works by simply creating big wins and small losses it does not rely on a high winning percentage to be profitable.
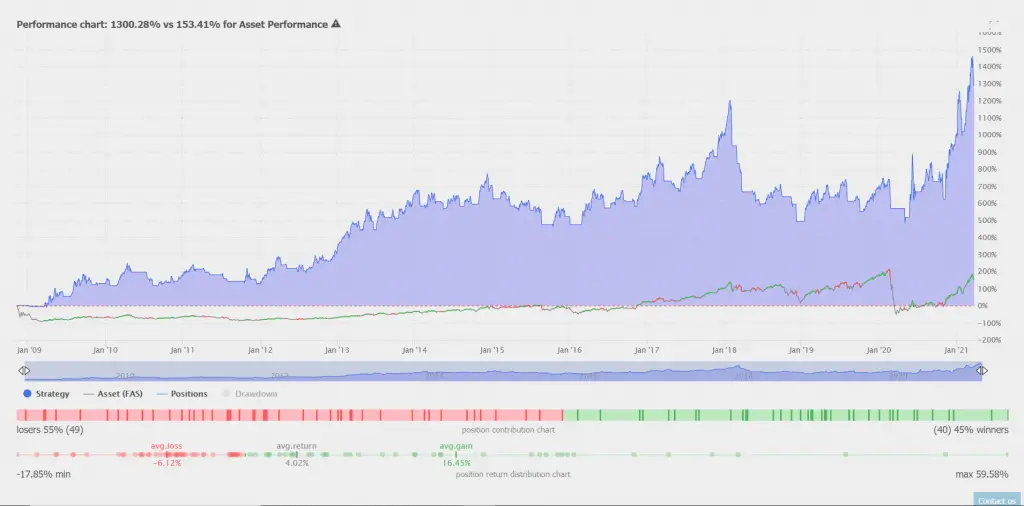
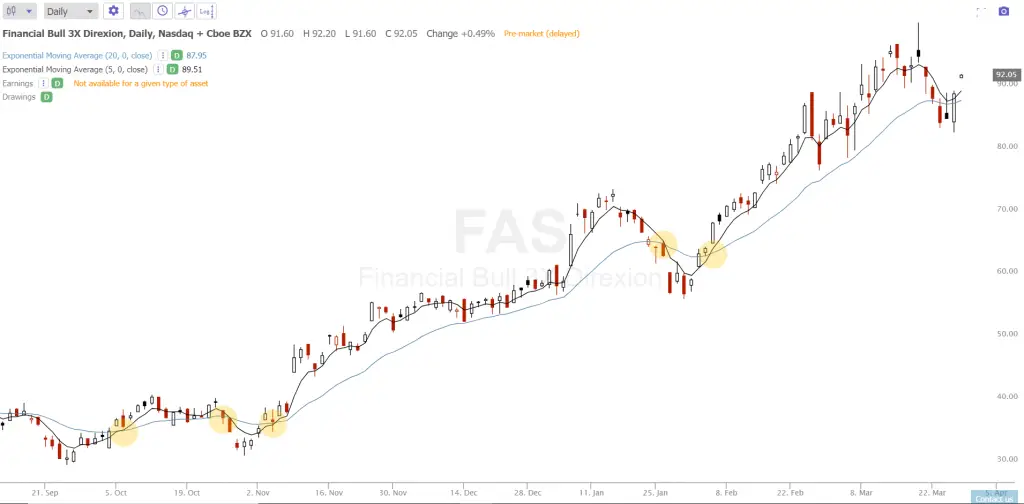
The below example shows the long term backtest on the $FAS ETF 3X leverage financials buying when the 5-day ema crosses and closes above the 20-day ema then selling when the 5-day ema crosses and closes back under the 20-day ema.


This signal can create a positive expectancy model on trading a chart even if it doesn’t beat buy and hold. It can also create better risk adjusted returns by taking a trader to cash when an investor would take a big loss during a pullback, correction, crash, or bear market. The exit can also be adjusted to selling when the chart has an overbought reading like the 70 RSI or on the first big bearish candle reversal. Adjusting the exit will affect the size of the wins and losses versus the backtest.
The best moving average crossover for swing trading that I have found after decades of chart studies and backtesting is the 5 day ema/20 day ema crossover. I use it daily on most of the charts on my personal watchlist.
You can learn more about trading with moving averages from my eCourses, Moving Averages 101, Moving Average Signals, or Backtesting 101 or from by book Moving Averages 101.