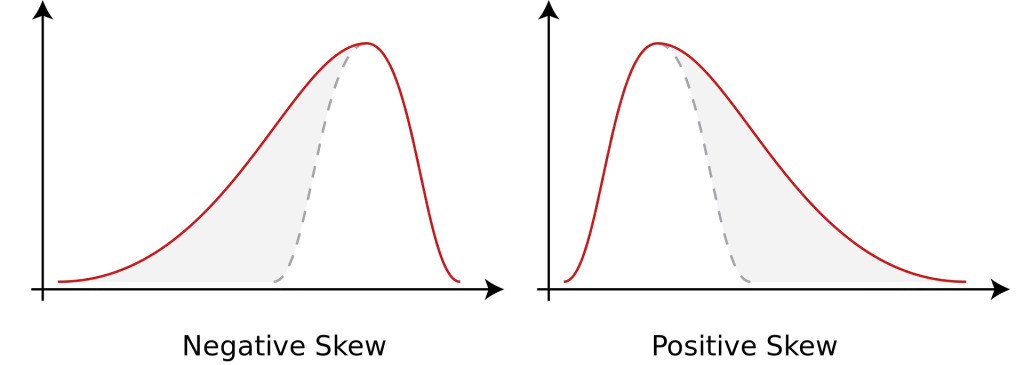
A skewed distribution is when one tail of data in a range is longer than the other side. A data set can have a positively skewed distribution or a negatively skewed distribution.
What is the difference between positive skew versus negative skew? Skewness is the measurement of a a coefficient that has the ability to be positive, negative or neutral (zero). The coefficient of the skew is the measurement of the magnitude of the symmetry in the distribution of outcomes of a specific data set of occurrences. A positive skew is skewed left and a negative skew is skewed right based on the data graph of information.
The first distribution below has a negative skew since it has a long tail in the negative direction. The second distribution shown has a positive skew. This means that it has a long tail in the positive direction.

Distributions with positive skews are more normal than distributions with negative skews. An example is the distribution of a systems trade outcomes. Most trades in a system could make under $500 each, but some make a lot more with a few making thousands of dollars. The positive tail could show a large extension of the range for big winners if the upside is uncapped, but the negative tail stops at the maximum loss of capital based on position sizing and a stop loss. For all or nothing bets with option contracts the negative skew could stop at zero.
The skewness enables traders and investors a way to quantify where the majority of outcomes fell for returns, risks, trades, and stocks in the past inside a probability curve. A skew can also show the frequency of low probability but high magnitude outlier events (Black Swans) if there are fat tails in either end of the chart. The above images are a graphic representations of potential outcomes, this can be monthly investment returns for a portfolio, individual trade profits and losses, or individual stock returns. The skew is the direction that the curve is tilted in for degree of outcomes, one chart showing more negative outcomes (negative skew) and one chart showing more positive outcomes (positive skew).
If the left tail is noticeably smaller at the end of the distribution than the the right larger tail end of the distribution, the data sample shows a negative skew. When the opposite is seen then it is a positive skew. When the two tails are equal in size meeting in the middle of the data set then it has zero skew and a symmetric outcome distribution.
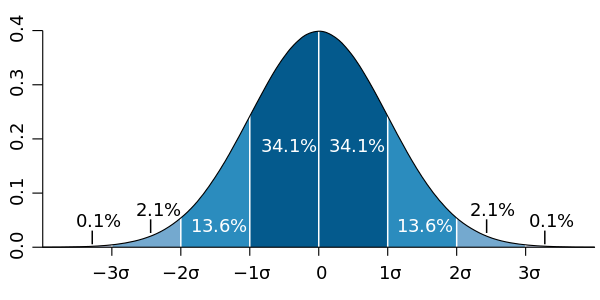
This final chart below shows distribution that is symmetric and has no skew.
Below is a normal perfectly symmetrical distribution with no skew.

By analyzing the skew of historical price action, trading signals, stock performance. or return samples it can help determine where future outcomes could fall. While skewness does not predict the future it can make better projections about the probabilities of certain outcomes going forward. A skew can also show fat tails at the edges of the data sample showing what can happen and alert you to outsized profits and risk events.
A measurement of the skewness of a data set shows if the potential deviations from the mean will be more positive or negative on average.
The tail of the distribution in a model will pull the mean. The most extreme values have a higher effect on the location of the mean than they do on the median.