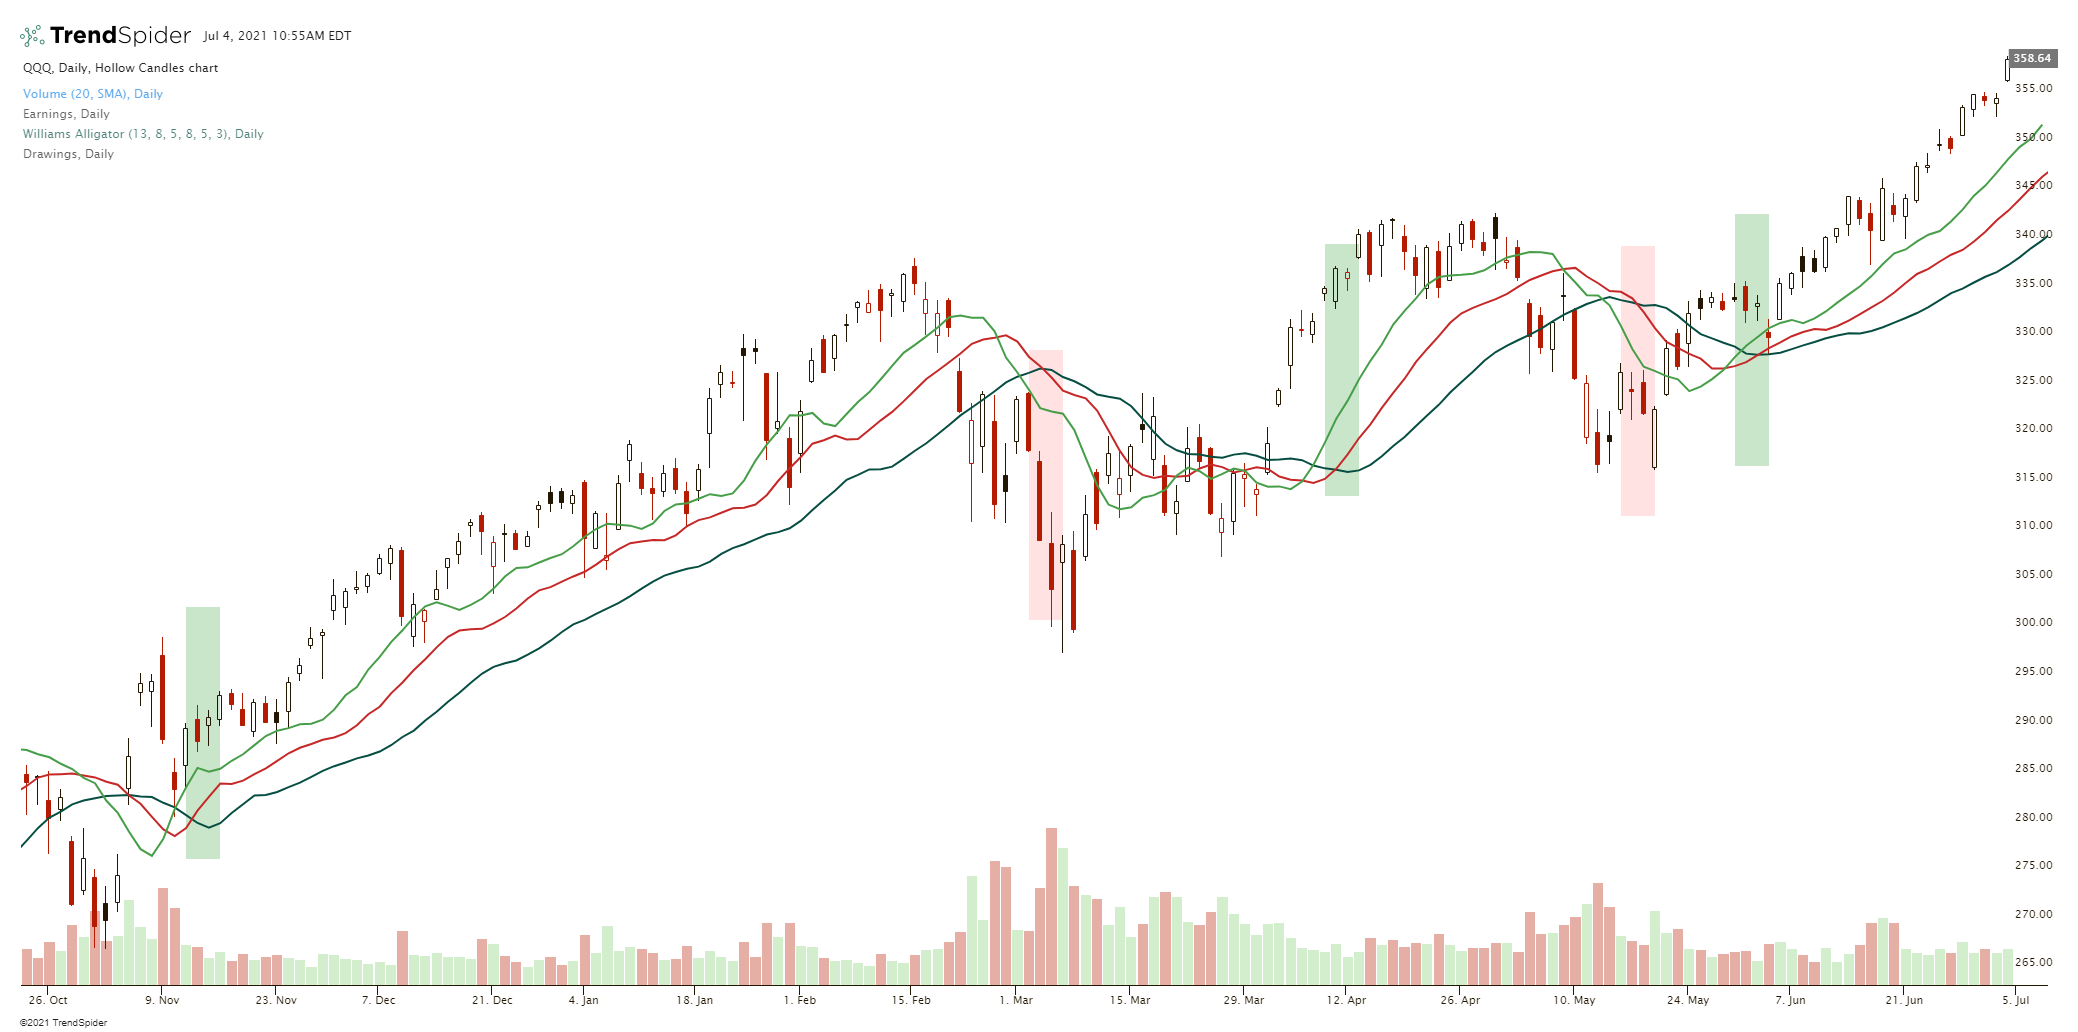
The alligator is the metaphor for this technical indicator. Three lines are used to create it on a price chart. Each line in the indicator is a moving average of a different time period: the 5 SMA , 8 SMA and 13 SMA. The lines represent the jaw(13), the teeth(8), and the lips(5)of the alligator. These moving average values are all Fibonacci numbers.
It is a trend trading indicator and designed to allow traders to quantify the direction of a market move and also signal a reversal. When the short term 5-SMA is over the middle 8-SMA which is also above the 13-SMA it signal an uptrend. When the short term 5-SMA is under the middle 8-SMA which is also under the 13-SMA it signals a downtrend.
There are various metaphors for Alligator signals. When the mouth of the Alligator is closed it is said to be sleeping (5-SMA / 13-SMA crossunder and then the lines are going sideways together). It is said that it gets hungrier while sleeping (The chart is in a range), and when it wakes up from its slumber it will eat (5-SMA/13-SMA crossover). When the trend begins the Alligator wakes and begins to eat (Moving average crossover signals). Once it is full again, it closes its mouth and goes back to sleep.
The Williams Alligator indicator was designed with the belief that markets and stock charts only trend 15%-30% of the time and trade in ranges the other 70% – 80% of the time. The late Bill Williams who was the creator of this indicator believed people made money in the markets primarly during trends and wanted to design a way to easily identify the trend while filtering for volatility.
When the three moving averages: the jaw, teeth, and lips converge and diverge they signal a change in the trend on the chart.
When the three moving averages diverge widely, it signal a strong trend. (The alligator is being fed according to Williams).
When the three moving averages start to go flat and converg together at the same value it shows the current trend is weakening and that it may reverse. This setup happens both at the end of a trend and before a new trend is established. [1]

