Chart Courtesy of TrendSpider.com
How do you do a backtest moving average crossover strategy?
A moving average crossover signal is when you use both a short term moving average and a long term moving average on the same chart. A crossover signal is generated when the moving averages break above or break below each other. A trader buys when the shorter term moving average crosses over the longer term moving average and sells when the shorter term moving average crosses back under the longer term one Instead of price crossing over or under a single moving average as a signal the shorter term moving average itself becomes the signal line as it crosses over the longer moving average. The best thing about moving average crossover signals is that they can capture trends and swings in price action while filtering out much of the volatility.
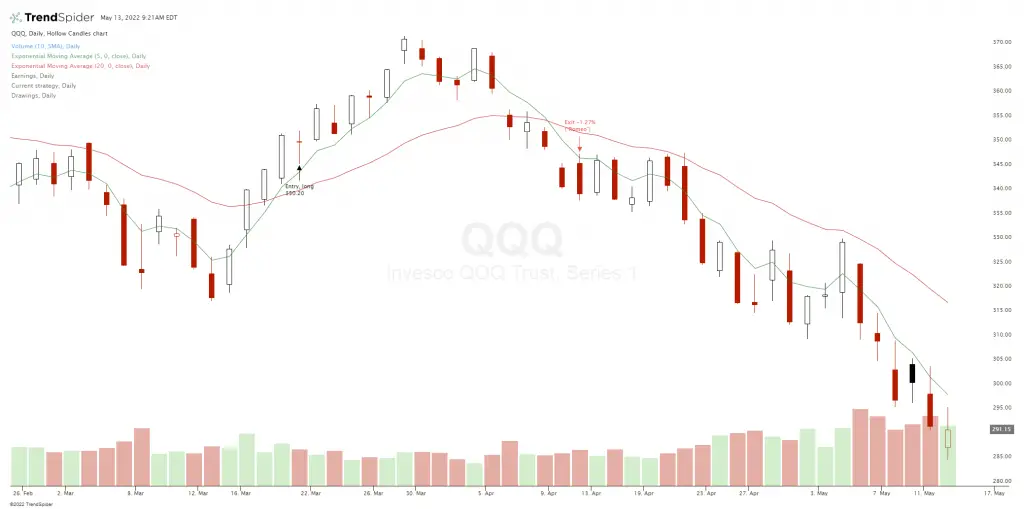
Using backtesting software you can set up an entry signal for when a shorter-term moving average closes over a longer-term moving average. Then you can set up an exit signal for when the shorter-term moving average closes back under the longer-term moving average.

TrendSpider strategy tester shown above.
What is the best moving average crossover combination?
What is the best back tested trading strategies with moving averages? What is the best specific moving average signal for capturing stock market trends? After trading and backtesting data for the past 25 years I have found two reoccurring profitable patterns for two moving average crossover signals best overall for most stocks, indexes, and sector ETFs. The two crossover signals that do well the majority of time for charts in uptrends are the 10-day / 50-day and the 5-day / 20-day exponential moving average crossover.
These signal are based on buying at the end of the day when the 5-day EMA closes above the 20-day EMA and selling at the end of the day when the 5-day EMA closes back under the 20-day EMA. (The same applies if you use the 10-day/50-day EMA signal interchangeably). This repeating pattern is a good mixture of a key short-term moving average smoothing out the gains from a longer term moving average and avoids most of the noise from price action cutting through one of the moving averages as a stand alone line creating a lot of false signals and volatility.
The 5-day/20-day EMA crossover is a swing trading strategy trying to capture shorter term swings, while the 10-day / 50-day EMA crossover is a trend trading strategy trying to capture longer term trends.
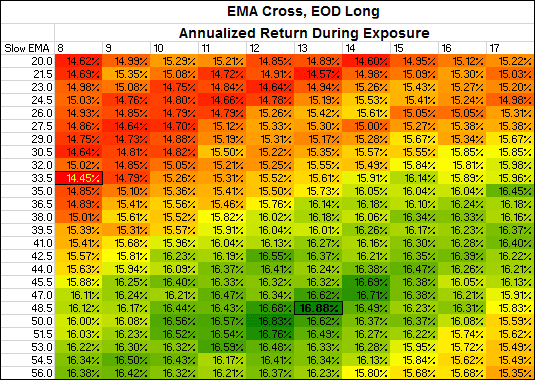
Interesting side note, after I determined the 10 day/ 50 day moving average as the best overall backtested moving average signal for profiting from stock market trends. In searching online when looking to confirm my research I found an article by ETF HQ that tested a massive number of combinations of moving averages to determine which two averages generated the highest crossover trading returns.
They used a total of 300 years worth of daily and weekly data from 16 different global indices to determine which two moving averages would have produced the largest gains for crossover traders.
The Results
First, ETF HQ found that exponential moving averages (EMAs), which weight most recent prices heavier than earlier prices, perform better overall than SMAs, which weight all prices in the timeframe equally.
Among short- and long-term EMAs, they discovered that trading the crossovers of the 13-day and 48.5-day averages produced the largest returns. Close enough for me to round the numbers to the 10-day / 50-day EMA for the sake of simplicity.

Trading strategy backtest results
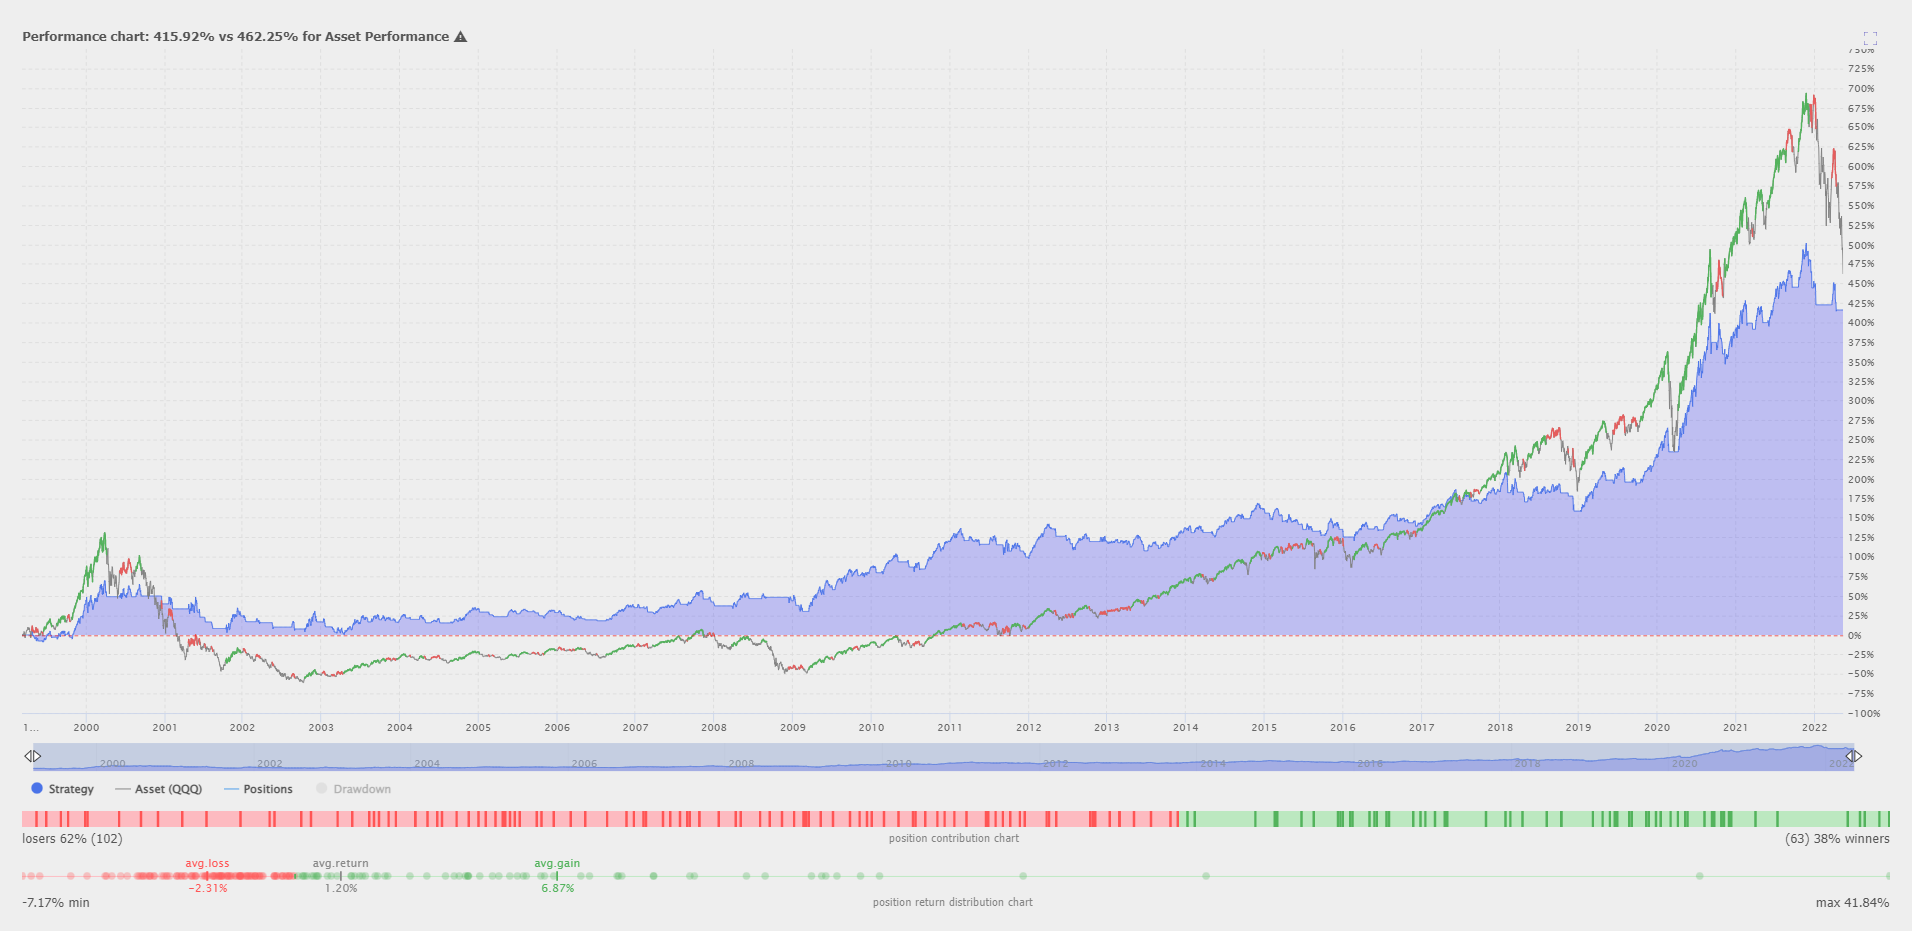
Here is an example of the 5-day / 20-day ema backtest on the QQQ chart. This swing trading strategy has a 1:3 risk/ reward ratio when traded mechanically. This signal can outperform buy and hold investing for years coming out of a bear market as it saves the trader from losses in the downtrend.

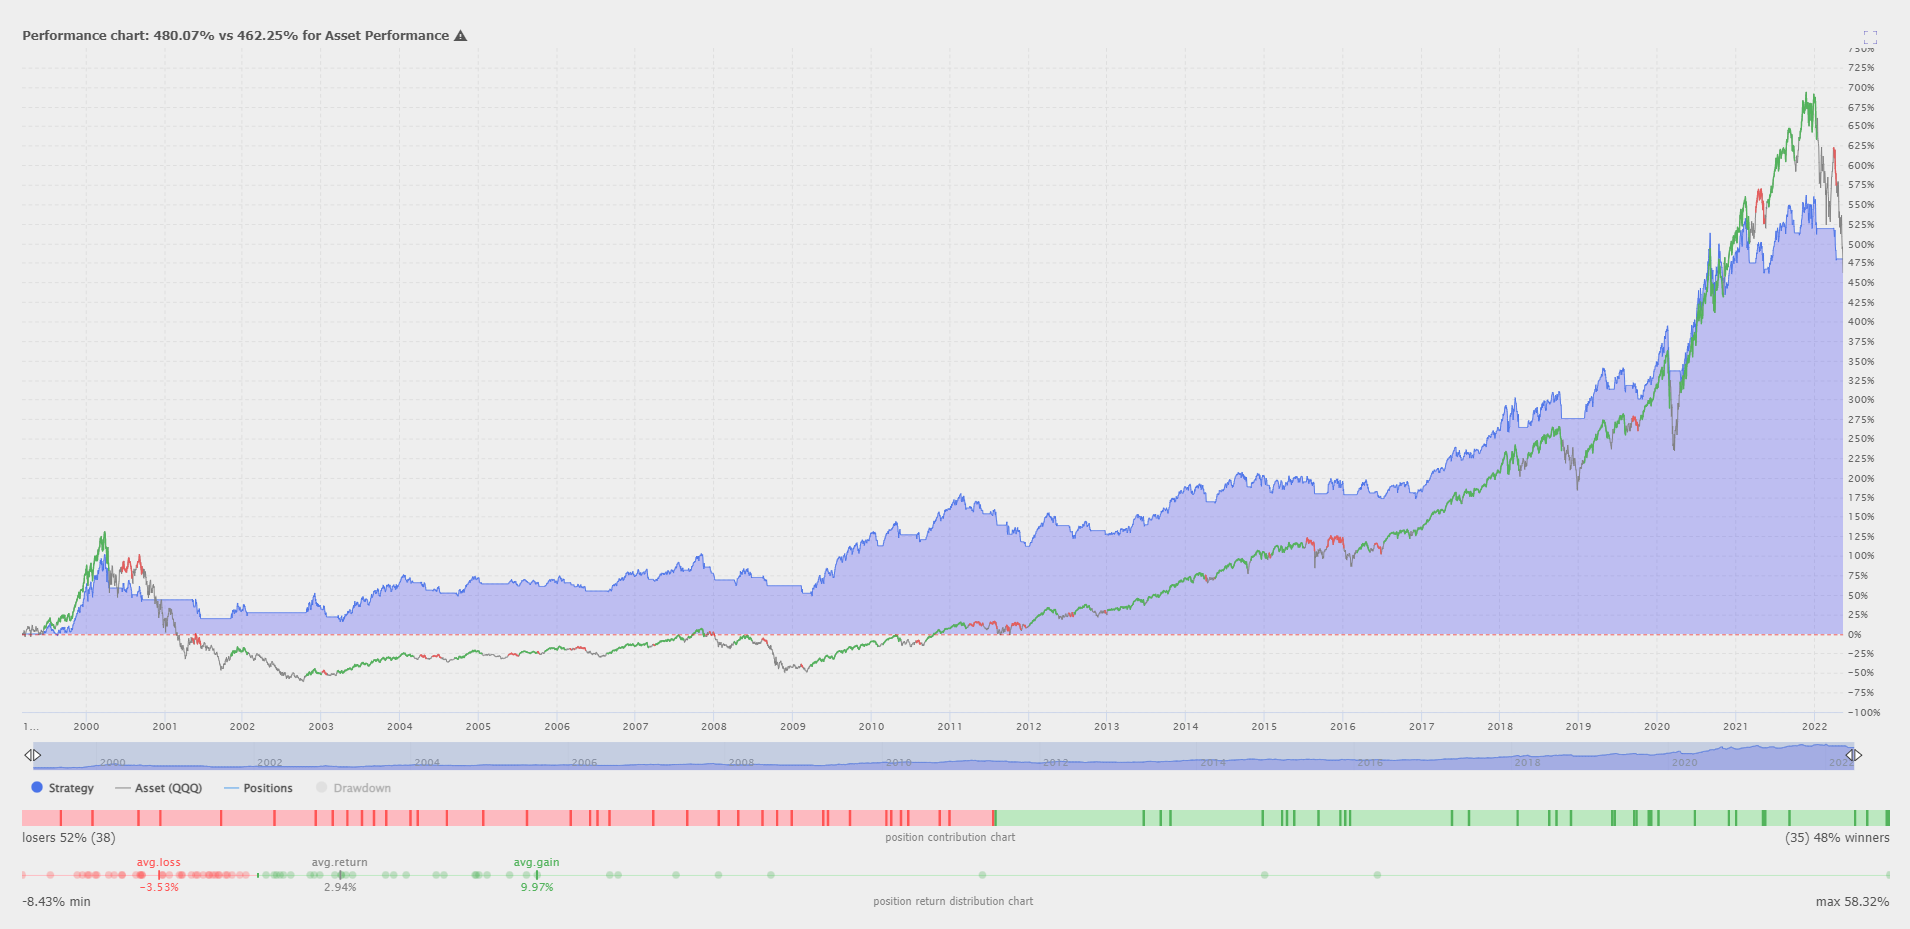
Here is an example below of the 10-day / 50-day ema backtest data on the QQQ chart. This trend trading strategy has almost has a 1:3 risk/ reward ratio when traded mechanically. This strategy outperforms buy and hold investing during bear markets and after bear markets when investors give back their bull market gains.

