Swing Trading Definition
Swing trading is a method of trading that tries to capture short-term or medium-term moves on a chart over a period of multiple days or weeks. Swing traders primarily use technical price signals for trading the moves in price action at the beginning and end of trends or inside an established wide trading range.
Swing Trade Stocks
Markets only trend a small percentage of the time, charts spend most of their time going sideways or become volatile and go nowhere. While catching a big trend can be profitable after a breakout or breakdown of a trading range there are other ways to make money.
Swing trading is a trading method that tries to capture gains in a market over a period of a few days to several weeks. The goal of a swing trader is to capture a large part of a potential trend in price action or simply buy support and sell resistance.
There are many different types of swing trading signals, buying the dip into oversold levels, buying the momentum of a swing back to the upside, or buying the dip into a key moving average support. Here are a few examples of my favorite swing trading signals to buy.
Moving average crossover strategy

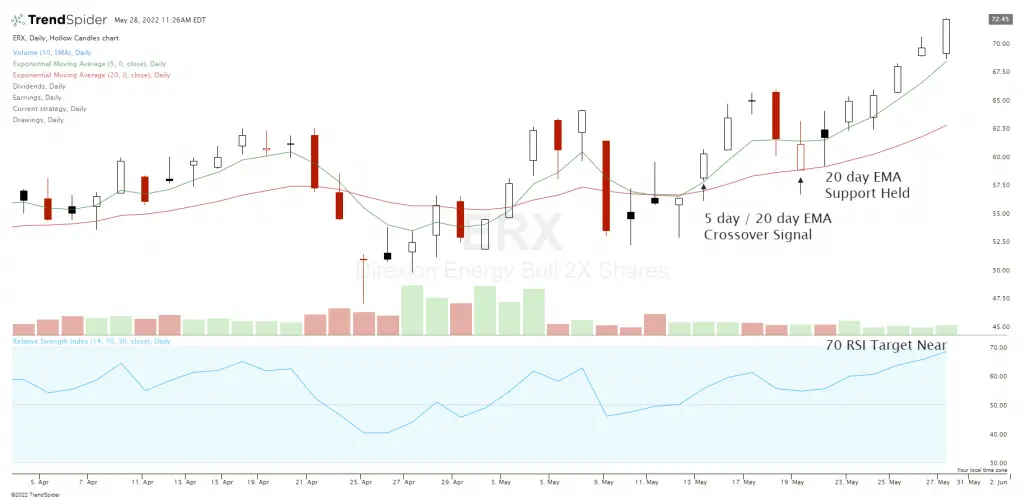
Moving average crossover signals can get you back into a swing back to the upside in price based on backtested signals that put the odds in your favor. The above example is an entry signal with the 5-day / 20-day EMA using the 20-day EMA as the initial stop loss and also the trailing stop as the chart is so volatile. You can decide to lock in profits at the 70 RSI overbought level or let your winner run for as long as possible by using the cross under of one of the moving averages as your exit signal.
When should you buy the dip?
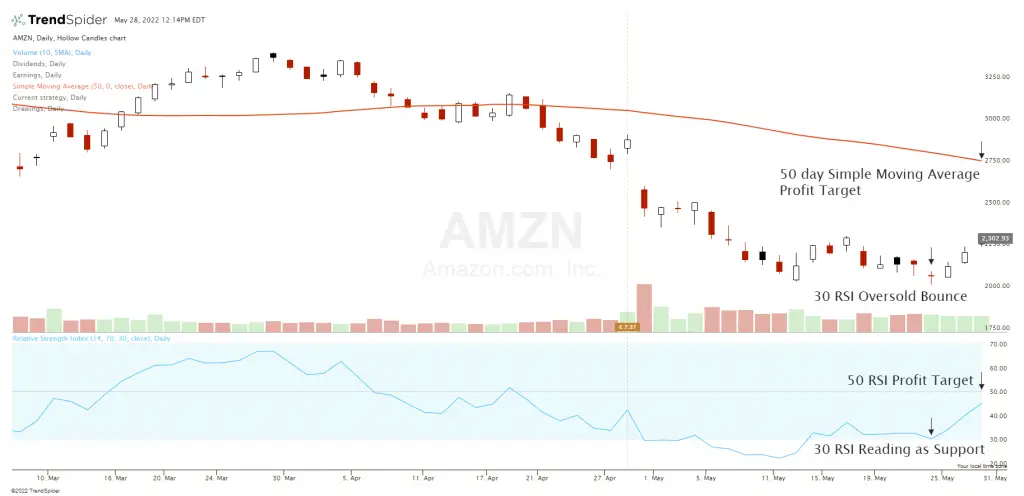
The best time to buy the dip on a chart is generally when the chart is both oversold and also shows a sign of reversing. The 30-RSI can be an oversold reading and a reversal candlestick can signal the first attempt at a bounce.

The above chart example is an example of buying price dips to the oversold 30 RSI level and how it can create great risk/reward ratios in the stock indexes and leading stocks as many times you will find buyers at those levels ready to step in and send the price back higher. The 50 RSI and 50 day moving average are good profit targets when you enter at the 30 RSI. A good initial stop loss is to exit if price closes below the 30 RSI.
200-day moving average signal

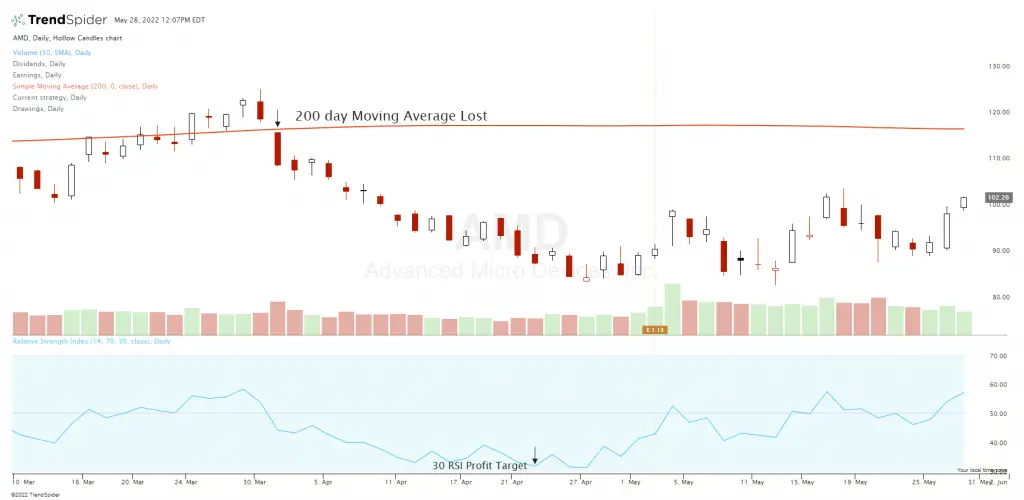
The above chart example shows the loss of the 200-day moving average. Many times markets in long term downtrends will begin after the 200-day moving average is lost. An initial short sell on this breakdown can present a good risk/reward entry as the loss of support at this long-term line can be the first sign that a new swing lower in prices could be underway. The profit target on this swing signal could be the 30 RSI if the breakdown happens at the 50 RSI which is usually the case.
These signals are not based on working every time, they are high probability signals and must be used with proper trade management of cutting losses short and letting winners run. The key to making money with swing trading is keeping your losses small with stop losses when they don’t work out and letting your winners run with trailing stops when they catch a favorable swing in price action.
Swing Trading Books
The Ultimate Guide to Swing Trading by Steve Burns
How To Swing Trade: A Beginner’s Guide to Trading Tools, Money Management, Rules, Routines and Strategies of a Swing Trader by Brian Pezim and Andrew Aziz