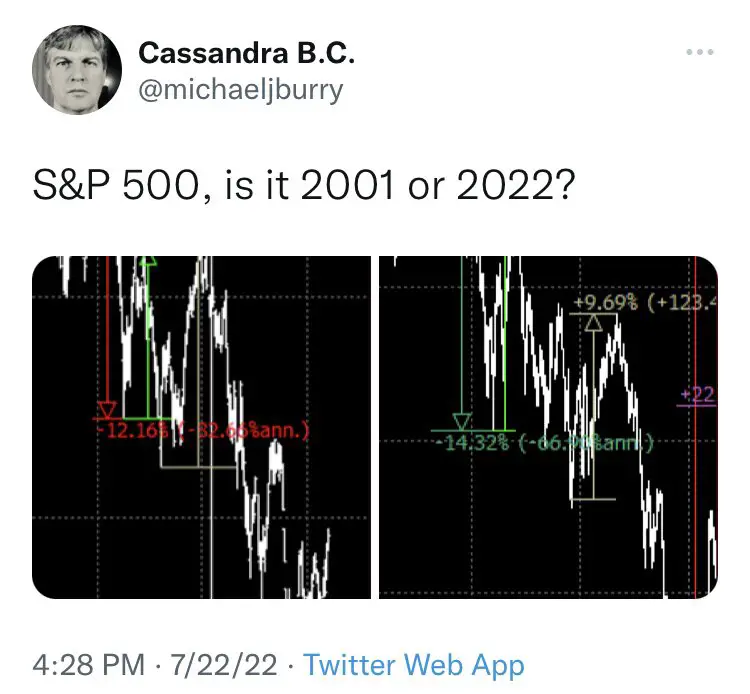
At the time Michael Burry first warned about inflation it was still under the Federal Reserve’s target rate of 2%.
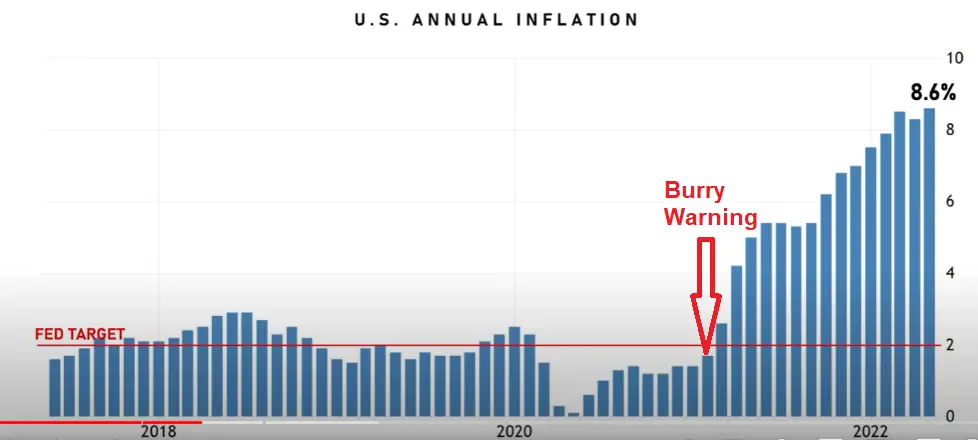
When Burry turned bearish in early 2021 he was in the minority, as most people in the financial world were bullish and central banks and politicians believed inflation was transitory. Since then, inflation has now gone up to a reading of 9.1% year over year as of the last BLS report of CPI.
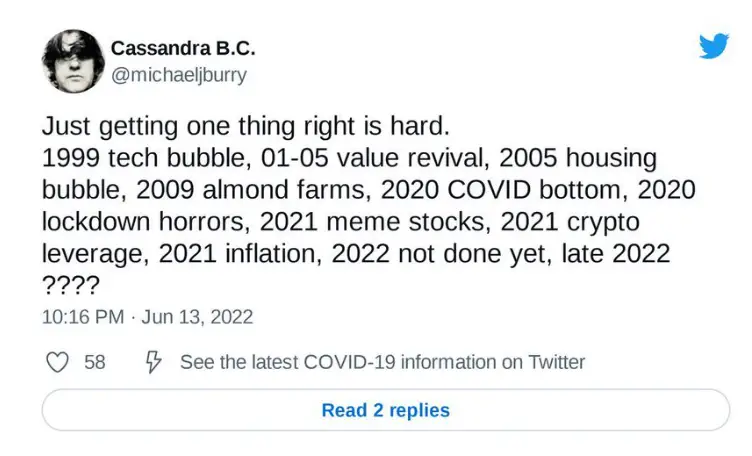
On June 13th, 2022, Michael Burry seemed to be predicting a market crash in late 2022 in the below tweet. This was tweeted after the recent majority of the downtrend on stock charts meaning he sees more downside this year.
Michael Burry Predictions
On June 30, 2022 Michael Burry tweeted that we were only halfway through the recessionary cycle as the stock market had P/E multiple compression and next there would be earnings compression. This points to him predicting we could be only halfway through the current bear market. This could project out to an S&P 500 price of approximately 2800 based on a historically normal P/E ratio of 16 for the stock market.
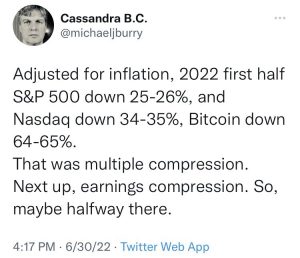
What Burry is warning about is during a recession, which the U.S. went into officially on Thursday with a second consecutive negative GDP of -0.90% for Q2, after the previous Q1 GDP was -1.6% that first the P/E multiple contracts then earnings contract.
The price to earning multiple is a type of investor sentiment showing how much value investors are willing to put on the current earnings of a company based on what they will be worth in the future looking at potential growth. This applies to individual companies looking at their projected growth in sales, revenue, earnings, and the competitive environment as well as equities as an asset class.
Think of the P/E like this:
Price = Earnings X Multiple is one formula for investor sentiment.
The more bullish and positive the economic environment the higher investors will bid up prices based on earnings. As the macro-economic environment turns negative the P/E ratio contracts and prices fall before earnings decline. The market prices in a future drop in profits.
So first the P/E multiple drops in the stock market, then the earnings start to decline, this is the fundamental market cycle. So according to Burry we are only in Phase 1 of valuation contraction and Phase 2 of earnings decline has only begun. He sees more downside from here as the stock market reverts to a more historical P/E ratio.
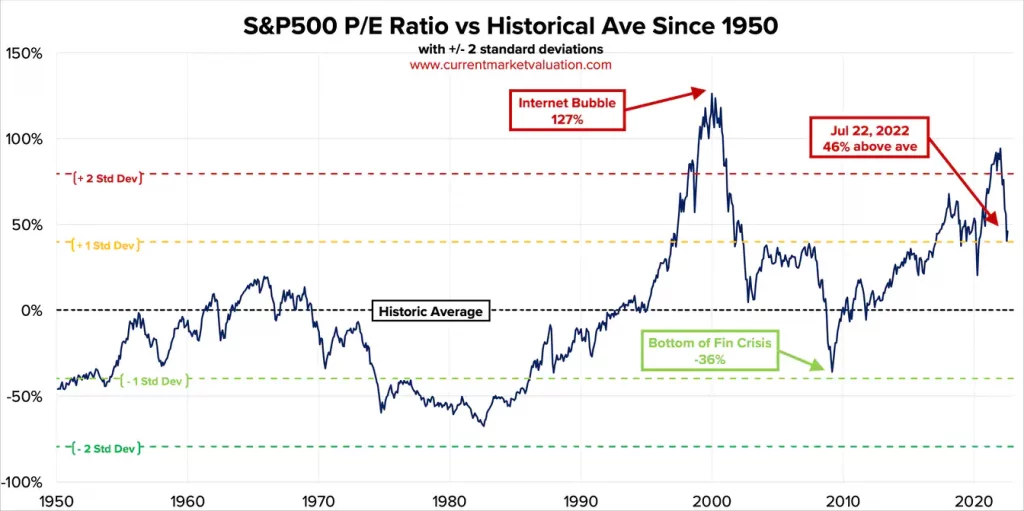
The current S&P 500 index 10-year P/E Ratio is 29.3. That’s 46% above the modern-era market average of 19.6, putting the current P/E ratio multiple 1.2 standard deviations above the modern-era average. The market is overvalued from a fundamental standpoint. This chart shows the historical trend of the P/E.
Michael Burry Recent Tweets
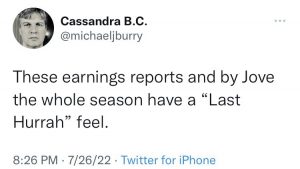
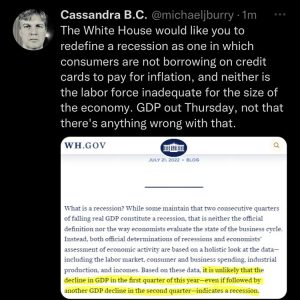
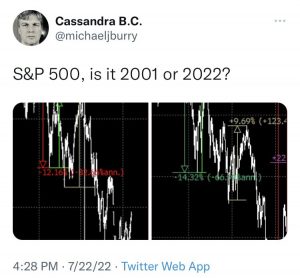
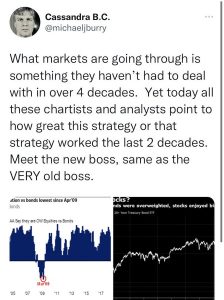

You can follow Michael Burry on Twitter at Cassandra B.C. @michaeljburry. He regularly deletes his tweets after sending them out and also had his blue checkmark verifying him removed recently. The Twitter account Michael Burry Archive @BurryArchive captures most his tweets and records them.
Michael Burry Portfolio
Here is the current portfolio of Michael Burry as of his 13F filing on 3-31-2022. The total current market value of his portfolio holdings is $201,379,000, with his top 10 holdings 94.14% of his portfolio. Michael Burry has a new Apple bet using 206,000 put options to short it.
Top 12 Holdings
Rank/Ticker/Company/Position Size/Market Value/% of Portfolio
- AAPL / APPLE INC (PUTS) 206,000 $35,970,000 (17.86%)
- BMY / BRISTOL-MYERS SQUIBB CO 300,000 $21,909,000 (10.88%)
- BKNG / BOOKING HOLDINGS INC 8,000 $18,788,000 (9.33%)
- DISCK / DISCOVERY INC-C 750,000 $18,728,000 (9.3%)
- GOOGL / ALPHABET INC-CL A 6,500 $18,079,000 (8.98%)
- CI / CIGNA CORP 75,000 $17,971,000 (8.92%)
- FB / FACEBOOK INC-CLASS A 80,000 $17,789,000 (8.83%)
- OVV / OVINTIV INC 300,000 $16,221,000 (8.06%)
- NXST / NEXSTAR MEDIA GROUP INC 76,200 $14,362,000 (7.13%)
- STLA / STELLANTIS NV 600,000 $9,762,000 (4.85%)
- GPN / GLOBAL PAYMENTS INC 66,700 $9,127,000 (4.53%)
- SPWH / SPORTSMAN’S WAREHOUSE HOLDINGS 250,000 $2,673,000 (1.33%)
If you are ready to improve your trading game you can get a more in depth understanding of how to use technical analysis for profitable trading with my best selling trading books on Amazon here.
I have also created trading eCourses on my NewTraderUniversity.com website here. My educational resources can save you time in your trading journey. Learn from my 30 years of experience in the markets.
