This is a guest post by Cory Mitchell, CMT of tradethatswing.com.
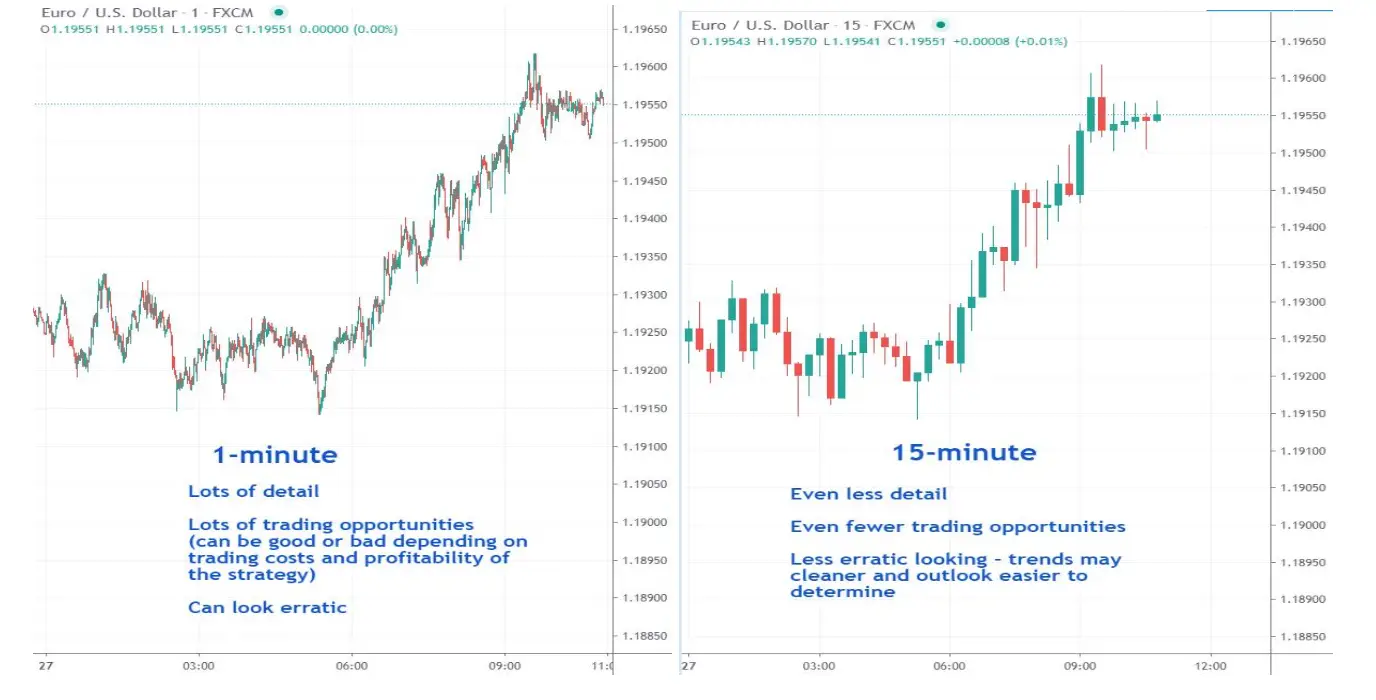
Day traders may trade on one timeframe or use multiple time frames. Which to use? Chart time frame examples: 1, 5, 15, 30, 60-minute. Also tick charts (a set # of transactions). Smaller time frames (1 minute) give more detail. Longer time frames (15min), less detail, they are smoother. 5 minute is more in the middle. One isn’t better than another. Depends on what you’re looking for. These charts show the same amount of time, 11 hours of price action, yet look quite different.

1-Minute: More action, small stop loss, bigger positions size, need more leverage/capital to make it worth it.
15-Minute: Fewer trades, bigger stop loss (requires more capital), smaller positions, not as hectic/fast paced.

Consider combining time frames. Find a setup on a longer time frame and drop to a lower time frame for exact entry and smaller stop loss.
- A triangle on a 60-minute chart is nearing the breakout point, for example.
- Drop down to 1-minute chart. Place stop loss below a recent swing low on 1-minute. This will likely be much closer than the swing low on the 60min chart.
- Small stop loss means bigger position size and bigger profit potential.
- Use a profit target from the 60-minute chart. This produces big Reward:Risk trades. When the price nears the target, drop to the 1-minute chart and exit on a reversal to avoid giving back much profit.
Scan and watch for patterns on longer time frames. Small time frame patterns come and go quickly.
I use the 1-minute for day trading. If I want a bigger perspective, I just zoom out my chart (squish it).
You can follow Cory on Twitter at @corymitc and check out his website at tradethatswing.com.
