Navigating the intricate world of stock trading can often feel overwhelming, but traders can find clarity and direction with the right tools, such as moving averages. This guide delves into the nuances of these essential technical indicators, shedding light on their significance in both short-term and long-term market analysis. Whether you’re a novice trader looking to understand the basics or a seasoned professional seeking to refine your strategy, this guide offers insights to enhance your trading understanding and decision-making. Join us as we unpack the power of moving averages and explore strategies to harness their full potential in the ever-evolving stock market landscape.
Moving averages are among the most popular and widely used tools in stock trading. They help traders identify trends, generate buy/sell signals, and determine potential support and resistance levels. Keep reading to delve into the intricacies of moving averages and how you can effectively use them in your trading strategy.
Moving Average Cheat Sheet
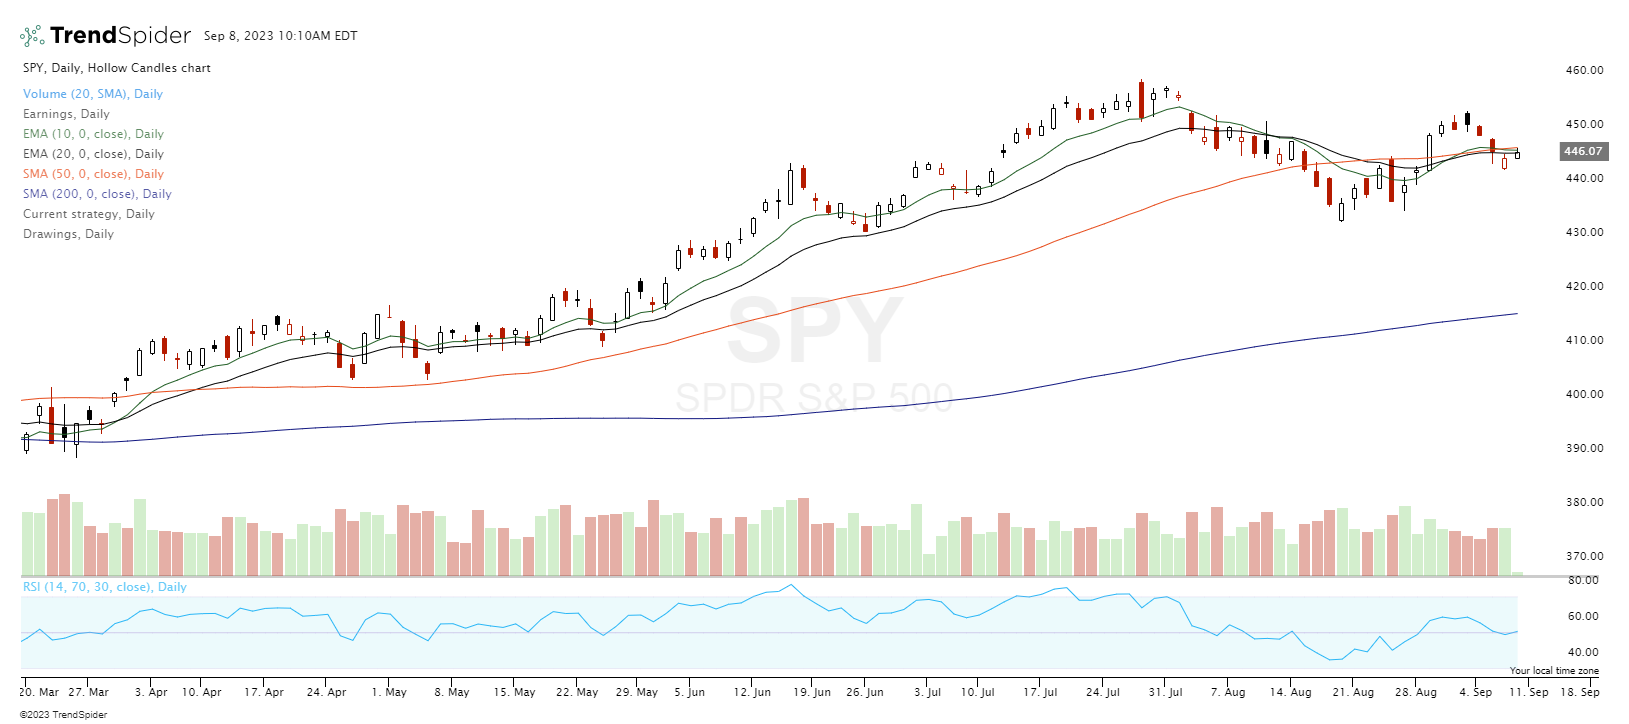
Here’s a list of some commonly used moving averages in trading, along with their typical uses:
- 10-day EMA (Exponential Moving Average)
- What it is: A moving average that gives more weight to recent prices, making it more responsive to recent price changes.
- Uses: Often used for short-term trend identification and to capture quick price movements. Due to its sensitivity, it can react faster to recent price changes compared to longer-term moving averages.
- 20-day EMA (Exponential Moving Average)
- What it is: Similar to the 10-day EMA but averages prices over 20 days.
- Uses: Used for identifying short to intermediate-term trends. It’s less sensitive than the 10-day EMA, providing a smoother line to help filter out some of the “noise” or short-term price fluctuations.
- 50-day SMA (Simple Moving Average)
- What it is: An average price data over the last 50 days.
- Uses: Widely watched by traders and investors as an indicator of the intermediate trend. A stock or asset trading above its 50-day SMA is generally considered in an uptrend while trading below can indicate a potential downtrend. Crossovers of the price over the 50-day SMA can also be used as buy/sell signals.
- 200-day SMA (Simple Moving Average)
- What it is: An average price data over the last 200 days.
- Uses: Regarded as a critical indicator of the long-term trend. Many institutional investors and traders watch the 200-day SMA closely. A stock or asset trading above its 200-day SMA is seen as having a long-term uptrend while trading below can suggest a long-term downtrend. The 200-day SMA can also act as a significant support or resistance level.
In trading, these moving averages can be used individually or in combination to generate signals. For instance, a crossover of the 50-day SMA by the 10-day EMA might be seen as a bullish signal, especially if accompanied by high trading volume. However, it’s essential to use moving averages with other tools and analysis methods to increase the odds of successful trading decisions.
Understanding Moving Averages
Moving averages, as the name suggests, provide an average of stock prices over a specific period, helping to smooth out price fluctuations and offer a clearer view of the overall trend. They are foundational tools in technical analysis, aiding traders in deciphering the often chaotic market data to discern the current trend of directional movement. Let’s delve deeper into the two primary types of moving averages: the Exponential Moving Average (EMA) and the Simple Moving Average (SMA).
Basics of the Exponential Moving Average (EMA)
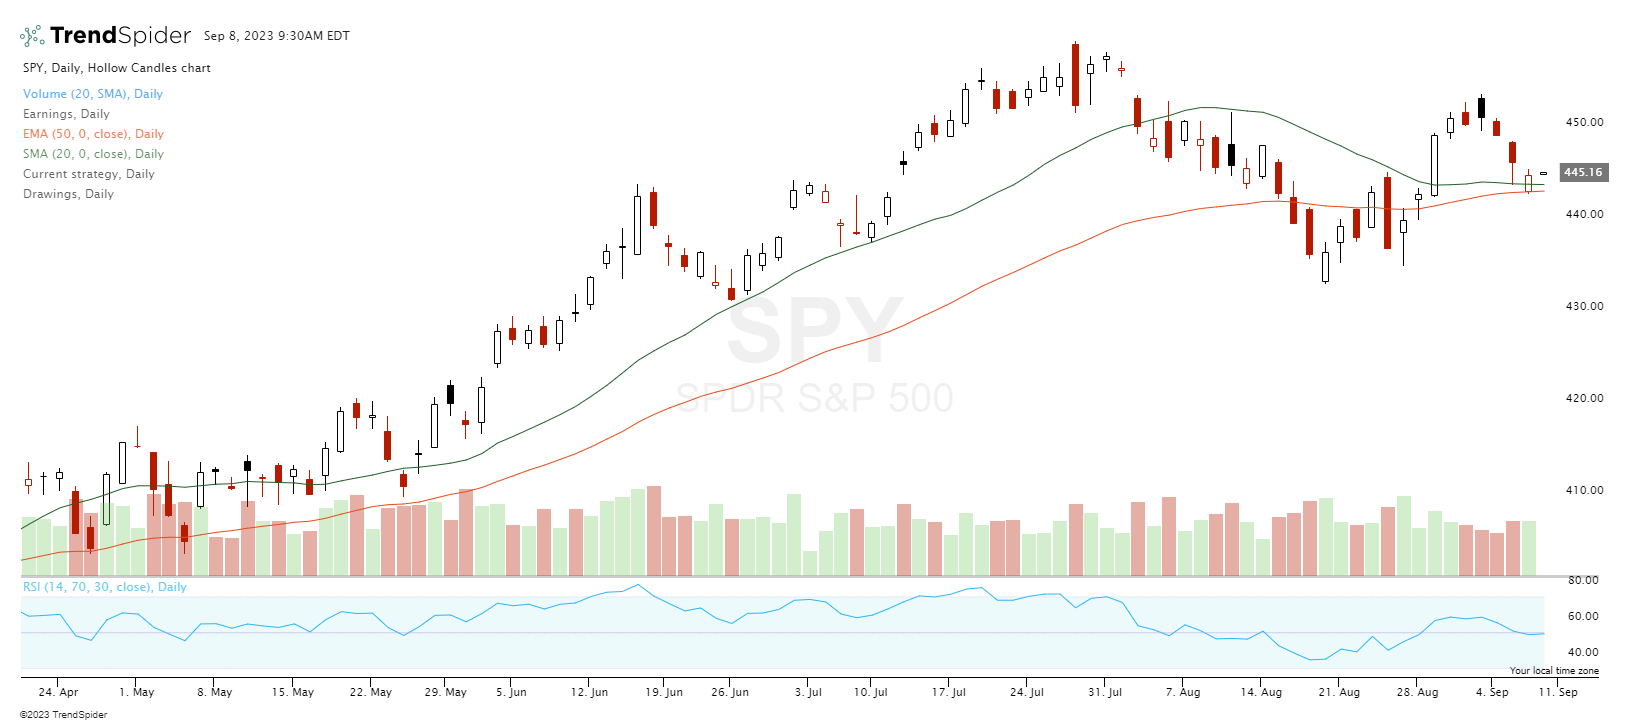
The Exponential Moving Average, or EMA, is a type of moving average that gives more weight to recent prices. This weighting makes the EMA more responsive to recent price changes, allowing traders to capture short-term market movements more effectively. The formula for the EMA involves taking the difference between the current price and the previous day’s EMA and multiplying it by a smoothing factor. This calculation ensures that the EMA reacts more dynamically to price changes compared to the SMA.
The EMA can benefit traders in volatile markets, where prices change rapidly. Its sensitivity can help identify potential trend reversals or continuations faster than other types of moving averages.
Diving into the Simple Moving Average (SMA)
The Simple Moving Average, commonly called the SMA, is calculated by taking the arithmetic mean of a set of prices over a specific number of days. For instance, a 50-day SMA will sum up the closing prices of the last 50 days and then divide by 50. The result is a smooth line that can help traders identify longer-term trends in the market.
The SMA is less sensitive to daily price fluctuations than the EMA, making it a more stable indicator. This stability can be both an advantage and a disadvantage. On the one hand, the SMA can help filter out the “noise” of short-term price movements, providing a clearer view of the overall trend. On the other hand, its lagging nature means it might be slower to respond to sudden market changes.
Both the EMA and SMA have unique strengths and trading applications. While the EMA is more responsive and can be beneficial in capturing short-term trends, the SMA provides a more stable and clear picture of longer-term market movements. By understanding the nuances of these moving averages, traders can make more informed decisions and develop robust trading strategies.
Short-Term Trend Analysis
In the fast-paced world of stock trading, identifying short-term trends can be both a lucrative opportunity and a significant challenge. These trends, which can last from a few days to a few weeks, offer traders the chance to capitalize on quick market movements. Moving averages, particularly the shorter-term ones like the 10-day and 20-day EMAs, play a pivotal role in this analysis. Let’s delve into how these specific moving averages can be employed to gauge short-term market directions.
Capturing Quick Movements with the 10-day EMA
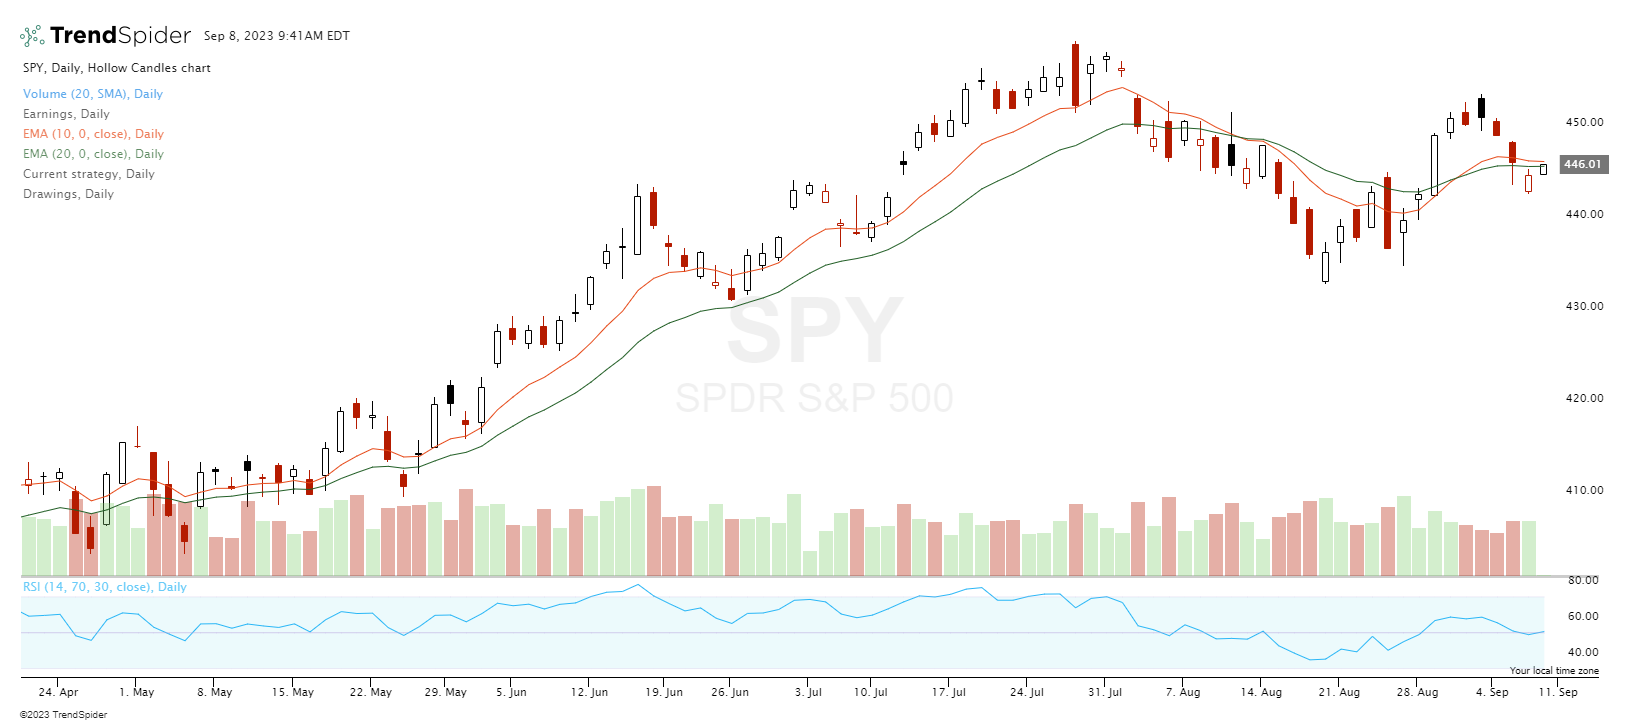
The 10-day Exponential Moving Average is a highly sensitive tool, making it adept at capturing swift market movements. Given its emphasis on recent prices, this EMA can quickly adapt to changes, making it a favorite among day traders and those looking to profit from short-term price swings. When a stock or asset price moves above its 10-day EMA, it can be an early indication of a potential upward trend. Conversely, a move below might signal a short-term decline.
The Role of the 20-day EMA in Intermediate Trends
While still catering to short-term movements, the 20-day EMA offers a slightly broader perspective. Spanning roughly a month of trading days, this moving average can help identify intermediate trends, which might last a few weeks. It strikes a balance between sensitivity and stability, filtering out some daily price “noise” while still offering timely signals. A consistent movement of a stock price above its 20-day EMA might indicate a strong short-to-intermediate bullish trend, while consistently trading below could suggest a bearish sentiment.
In essence, for traders aiming to navigate the short-term waves of the stock market, tools like the 10-day and 20-day EMAs are invaluable. They provide timely insights, helping traders make informed decisions in a market that can often change direction immediately. However, as with all tools, it’s crucial to use them in conjunction with other indicators and maintain a robust risk management strategy.
Intermediate and Long-Term Trend Indicators
While short-term trading can offer quick profits, many traders and investors also focus on intermediate and long-term trends to capture more significant market movements and reduce the noise of daily volatility. These longer trends can provide more stable and sustained returns, especially when combined with a disciplined trading strategy. Moving averages, particularly the 50-day SMA and the 200-day SMA, are cornerstone tools for identifying these trends. Let’s explore how these moving averages can be harnessed to gauge the broader market trajectory.
The Significance of the 50-day SMA in Stock Trading
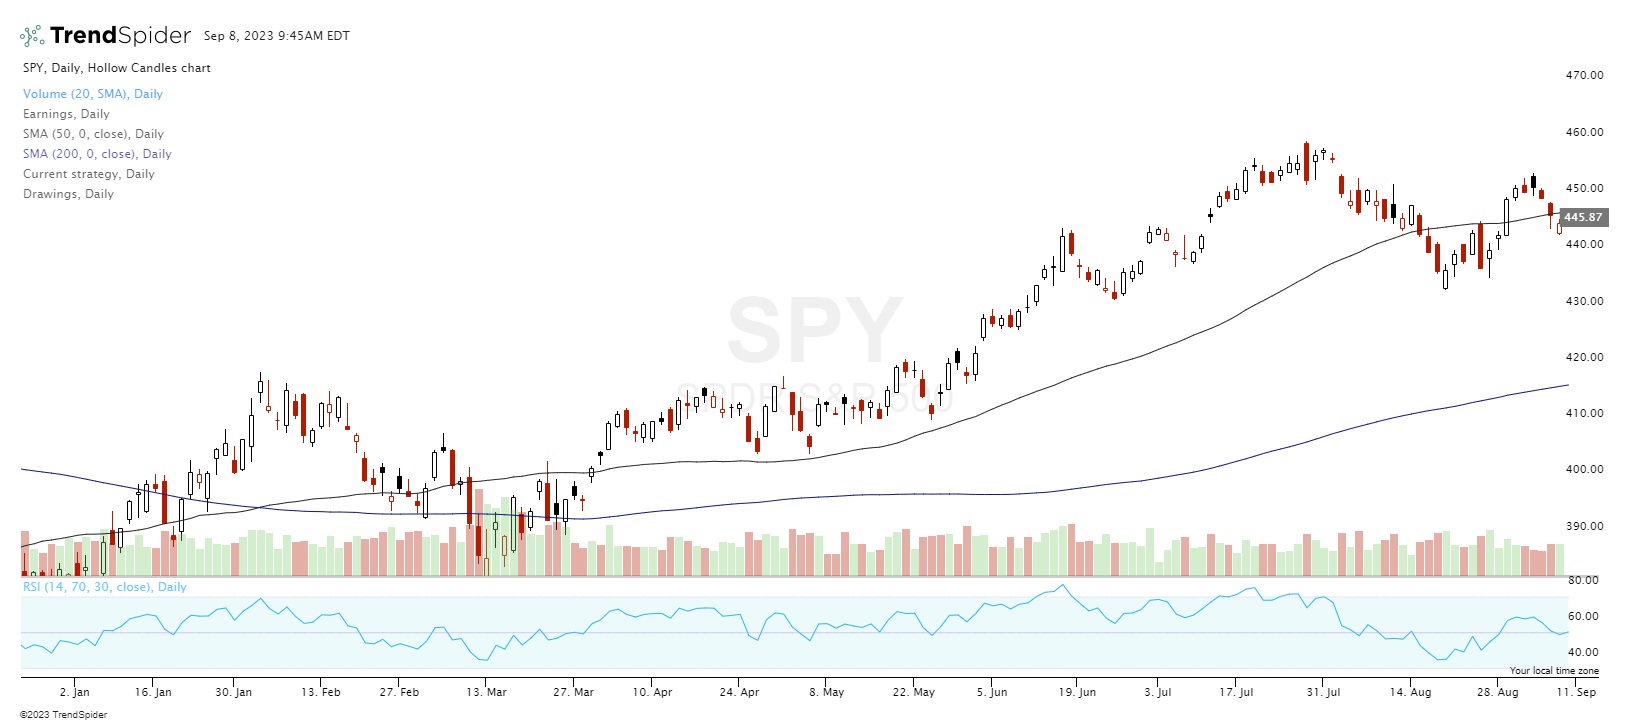
The 50-day Simple Moving Average is a widely recognized and utilized indicator in the trading community. By averaging out the closing prices over the last 50 days, this SMA provides a clear picture of the intermediate trend, which can span several weeks to a few months.
A stock trading above its 50-day SMA is typically viewed as having a positive intermediate outlook, suggesting bullish sentiment among traders. Conversely, if a stock consistently trades below its 50-day SMA, it might indicate potential bearishness in the intermediate term. Additionally, when a stock’s price crosses the 50-day SMA, it can serve as a buy or sell signal for many traders, depending on the direction of the crossover.
Using the 200-day SMA for Long-Term Trend Insights
The 200-day Simple Moving Average is a beacon for long-term trend analysis. By taking into account roughly 200 days of trading, this SMA offers insights into the broader, more sustained market movements. It’s a favorite among institutional investors and is often considered a significant barometer of market health.
When a stock or asset consistently trades above its 200-day SMA, it’s seen as being in a long-term uptrend, reflecting positive sentiment over an extended period. On the flip side, trading below the 200-day SMA can be a warning sign of a long-term downtrend. Furthermore, the 200-day SMA often acts as a significant support or resistance level, with many traders watching for price reactions around this line.
While the allure of quick profits in short-term trading is undeniable, understanding intermediate and long-term trends is crucial for sustained success in the stock market. The 50-day and 200-day SMAs serve as reliable compasses, guiding traders and investors through the vast and often turbulent financial seas. By respecting these indicators and combining them with other tools and sound risk management, traders can navigate the market more confidently and clearly.
Strategies and Signal Generation
In the realm of stock trading, merely identifying trends isn’t enough. Traders need actionable signals to guide entry and exit points, helping them capitalize on market movements. Moving averages, with their ability to smooth out price data and highlight trends, are pivotal in generating these signals. Let’s delve into some of the primary strategies involving moving averages and how they can be employed to produce actionable trading signals.
Crossover Techniques: Combining Short and Long-Term MAs
One of the most popular strategies involving moving averages is the crossover technique. This method consists of observing the interactions between short-term and long-term moving averages.
For instance, when a short-term moving average, like the 10-day EMA, crosses above a longer-term moving average, such as the 50-day SMA, it can be perceived as a bullish signal. This crossover suggests that recent momentum is in the upward direction. Conversely, when the short-term average crosses below the long-term average, it can indicate potential bearish momentum.
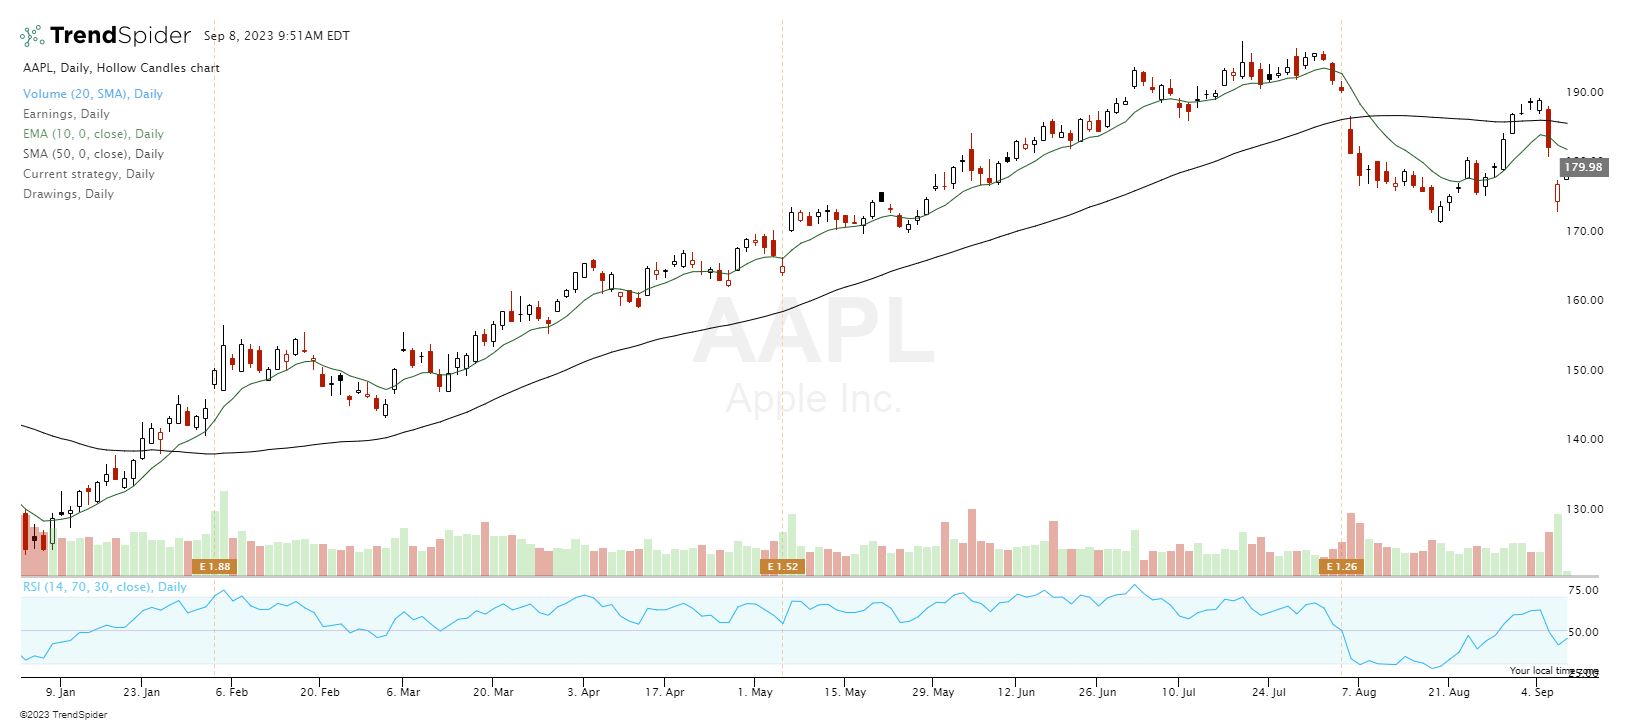
These crossovers can be potent signals, especially when combined with other indicators or confirmed with high trading volume.
Identifying Support and Resistance with Moving Averages
Moving averages don’t just help with trend identification; they can also act as dynamic levels of support and resistance. For many traders, a moving average, especially widely-watched ones like the 50-day or 200-day SMA, can serve as a line in the sand.
For example, during an uptrend, a stock might pull back to its 50-day SMA before bouncing back, indicating that this moving average is a support level. Similarly, a stock might face resistance in a downtrend when trying to move above its 200-day SMA.
Recognizing these support and resistance levels can provide traders with strategic entry and exit points, allowing them to set clear stop-loss and take-profit levels.
Moving averages are more than just trend indicators; they are versatile tools that can be woven into various trading strategies. By understanding their nuances and combining them with other technical and fundamental analysis methods, traders can generate clear, actionable signals to guide their trading decisions. As always, it’s crucial to remember that no single indicator or strategy guarantees success, and a holistic, disciplined approach to trading is essential.
Enhancing MA Analysis with Volume and Other Indicators
For a more holistic analysis, traders often combine moving averages with other technical indicators.
The Importance of Volume Confirmation in MA Strategies
Volume plays a crucial role in confirming the strength of a trend. A breakout above a moving average accompanied by high volume is typically a stronger signal than one with low volume.
Integrating Moving Averages with Other Technical Tools
Combining moving averages with tools like the Relative Strength Index (RSI) or Bollinger Bands can provide more comprehensive insights and refine trading signals by seeing if there is a confluence of matching signals.
Common Pitfalls and How to Avoid Them
Like all trading tools, moving averages come with potential pitfalls.
Dealing with Whipsaws and False Signals
Whipsaws, or false signals, occur when the price briefly crosses a moving average but quickly reverses. It’s essential to use additional confirmation signals to avoid getting caught in whipsaws. Moving averages are trend and momentum indicators and don’t do well on highly volatile charts or when there is choppy price action. Moving averages are designed to capture directional moves; they lose money when there is sideways action or no sustained direction.
The Risk of Relying Solely on Moving Averages
While moving averages are powerful, relying solely on them can be risky. It’s always best to use them with other tools and analysis methods. It’s also crucial to use proper position sizing and risk management as moving averages point to the path of least resistance not to certainty for a winning trade.
The Holistic Approach to Moving Averages in Stock Trading
Moving averages are invaluable tools in a trader’s toolkit. However, their real power emerges as part of a comprehensive, well-thought-out trading strategy. By understanding their strengths and limitations, traders can harness the potential of moving averages to navigate the stock market effectively.
Key Takeaways
- Grasping Moving Averages: Both Exponential (EMA) and Simple Moving Averages (SMA) offer invaluable insights into market trends, with EMAs being more reactive and SMAs providing a steadier perspective.
- Spotting Short-Term Dynamics: Tools like the 10-day and 20-day EMAs are instrumental in discerning swift market shifts and intermediate market flows.
- Long-Term Trend Insights: The 50-day and 200-day SMAs are pivotal in understanding broader market directions, often as crucial benchmarks for traders and institutional investors.
- Signal Crafting with Crossovers: Interactions between short and long-term moving averages, especially crossovers, can yield potent buy or sell signals.
- Dynamic Support and Resistance: Moving averages can double as fluid support and resistance levels, guiding traders in setting strategic entry and exit points.
Conclusion
Harnessing the power of moving averages can significantly enhance a trader’s arsenal, offering clarity amidst the market’s inherent chaos. By adeptly navigating between swift market ripples with tools like EMAs and understanding overarching market currents with SMAs, traders can craft informed strategies. While these averages are undoubtedly insightful, their true potential is unlocked when integrated into a comprehensive, disciplined trading approach, always complemented by other analytical tools and a keen awareness of market psychology.
