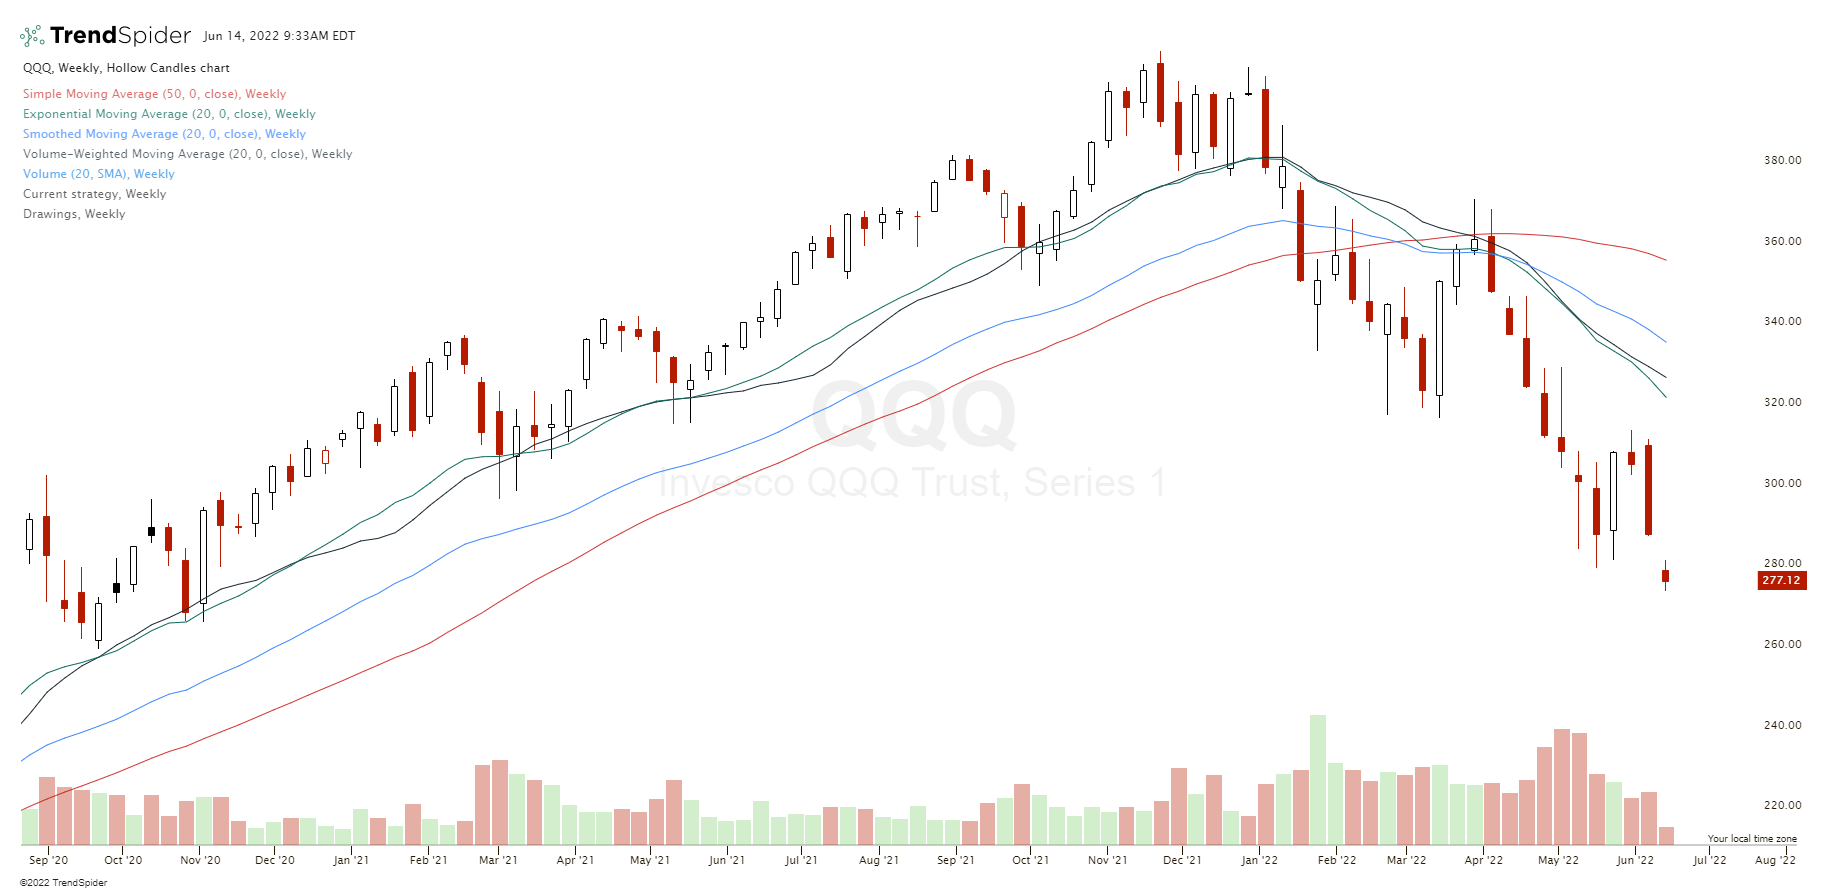
There are four primary different types of the most popular used moving averages on charts by traders: Simple (SMA), Exponential (EMA), Smoothed (SMMA), and Volume Weighted (VWMA). Different moving averages can be calculated different ways depending on their type using any sequential data sample size, this could include opening and closing prices, highest and lowest prices in a range, trading volume on a chart or averages of other indicators.

Simple Moving Average (SMA)
The simple moving average is just that, simply the moving average over the period of your chosen time frame. It’s slow to react to changes in price action as each data point is just one of the total sequence of data points. On a 10-day simple moving average, one day is weighted as one tenth of that moving average. The simple moving average is a slower signal to get you in and get you back out of a trade. It tends to work better on slower markets like market indexes and big cap stocks as they tend to move less in percentage terms and more time can be taken to get in and out in most trades. Also the majority of traders tend to use the simple moving average for longer term moving averages like the 50-day and the 200-day simple moving average so they can see more responses of buyers and sellers around those key lines as they are more popular on those time frames.
A charting platform will calculate a simple moving average for any time frame using the number of prices within a time period divided by the number of total periods.
Exponential Moving Average (EMA)
The exponential moving average is a faster moving average and gives more weight to recent prices than past prices and changes more quickly to adapt to the current market trend. The EMA starts with the SMA data but adds a multiplier to the more recent price data points than the past ones. The EMA calculations decreases the weighting of older price data and increases the weighting of newer price data based on how old the prices are. An EMA can work better in faster markets that move more in shorter time frames as it is more adaptive to present price data and will get traders in and out quicker than an SMA. I have found better backtesting results on EMA crossover signals overall than SMA cross over signals in my hundreds of hours of backtesting moving average systems on the stock market.
Charting platforms use the following formula to calculate the current EMA: EMA = Closing price x multiplier + EMA (previous day) x (1-multiplier)
Smoothed Moving Average (SMMA)
A smoothed moving average (SMMA) is like a simple moving average (SMA) as it tries to quantify the trend in a specific time frame. However, the SMMA would rather filter price action noise than reduce the signal lag time. The SMMA changes, moves, and curves much slower than the more popular SMA. A smoothed moving average is a type of exponential moving average with a longer time period of prices used.
The calculation of the SMMA does not contain a fixed time period, it takes the full historical price data series into the formula. The SMMA formula is calculated by subtracting yesterday’s SMMA from today’s price and adding this sum to yesterday’s SMMA, resulting in today’s moving average line.
This technical indicator uses all prices into calculating the SMMA line and uses a long previous time period of data. The older prices on the chart are never completely removed from it’s calculation, although the oldest data has a very low effect on the moving average due to a lower weighting the older the data. With the SMMA lowering the amount of noise priced in to the price it reduces the wilder fluctuations and focuses on showing the primary trend on the chart.
The SMMA can be used to both identify and quantify trends and signal horizontal or vertical support and resistance on a chart in a trend. The smoothed moving average is best used in combination with other indicators for a confluence of signals and for a full view of an SMMA inside the context technical analysis. It is a very slow moving average and better for traders that want to ride a longer term trend with fewer entry and exit signals. The SMMA can be used in the same ways as an SMA or EMA in trading, but with less velocity.
The smoothed moving average (SMMA) formula:
SMMAi = (Sum – SMMAi-1) / N
Answer key:
SMMAi – Is the value of the period being calculated.
Sum – Is the sum of the source prices of all the periods, over which the indicator is calculated.
(Sum = Pricei + Pricei-1 + … + Pricei-N+1)
SMMAi-1 – Is the value of the period immediately preceding the period being calculated.
Price – Is the source (Close or other) price of any period participating in the calculation.
N – Is the number of periods, over which the indicator is calculated.
Volume Weighted Moving Average (VWMA)
The volume–weighted moving average (VWMA) quantifies the quantity of volume that prices traded at on a chart. The VMWA weighs prices based on the volume of trades in a time frame. The VMWA is represented by a line on a chart that changes as price and volume changes. Traders can use VWMAs for different time frames based on their own system. Areas of specific price action on a chart with more trading activity will receive more weighting in its formula than price zones with less trading activity. In time periods with equal or similar volume on each candle, the simple moving average and the volume weighted moving average can be very similar in value.
The VWMA is not the same as VWAP they are very different technical indicators.
VWAP is a cumulative of the average price with respect to volume. It doesn’t drop off data over time. The calculation begins at the start of the trading session for the time frame being measured and is continually calculated as new data is added.
VWMA is a moving average of price with volume considered inside the formula to weight by quantity of trades that occurred at different price levels. It calculates all the price and volume data over the time period of the moving average. The formula begins the calculation at the beginning of the time frame being measured and adjusts as new price and volume data is introduced, older data drops off. The VMWA is a technical indicator that calculates the average of available closing prices adjusted for volume.
The volume weighted moving average (VWMA) is a very similar tool to the simple moving average (SMA), and the exponential moving average (EMA) and is used as a technical indicator in much the same way to trade trends. However, like the EMA gives more weight to recent prices the VMWA gives more weight to the volume of specific prices. The VMWA can be backtested in the same way as other moving averages and can be used as an indicator of a trend based on which side of the line price is on. A price above the VMWA is bullish for the time frame of the line and could be bearish when price drops below the line for the time frame being traded. A VMWA crossover of two different timeframes can smooth out much of the volatility of using one VWMA on a chart.
The volume-weighted moving average indicator applies the moving average to both, price times volume and simple volume. The next step of the calculation involves simply dividing price times moving average to volume moving average. The result will be your volume-weighted moving average.
Volume weighted moving average (VWMA) = [(Price 1 × Volume 1) + (Price 2 × Volume 2) + (Price 3 × Volume 3)] / (Volume 1 + Volume 2 + Volume 3)
Where: Price (n) is closing price from n period and volume (n) is volume from n period.
Here are my four moving average books covering the principles for using them in your trading:

