Reversal candlestick patterns are the formation of multiple candles which signal the potential end of the current directional swing or trend in price to the opposite direction. When these patterns occur during a downtrend, it signals a bullish reversal and buyers taking control bidding up price. When these patterns occur during an uptrend, it signals a bearish reversal and sellers taking control bidding down price.
What do wicks mean in trading?

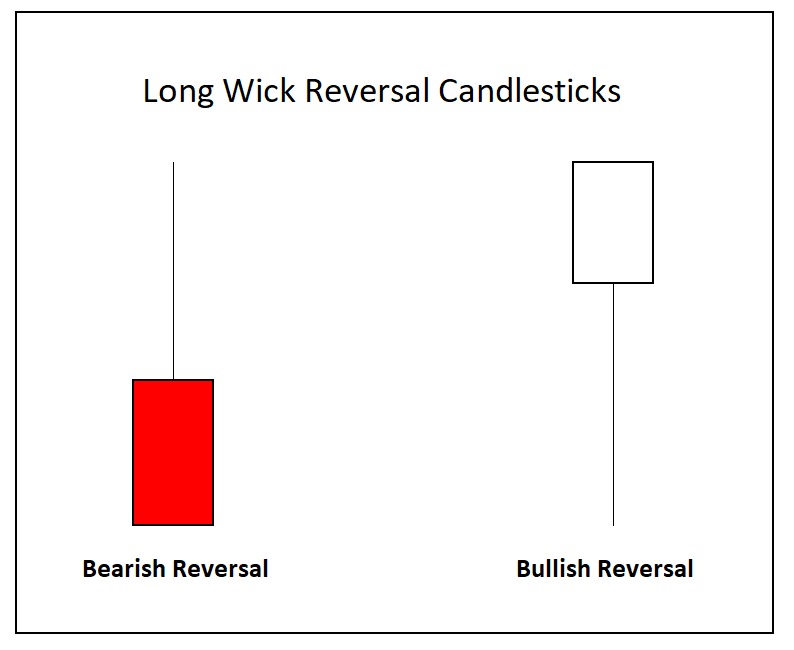
Wicks are lines on candles that show price movement outside the opening and closing prices of that period. Upper wicks show price movement higher than the open and close while lower wicks show where price went lower than the open or the close. Wicks show volatility and movements outside the opening and closing range that were rejected by the close of the candle, these are signs of reversals from one direction.
The longer the wick the stronger the failure of a directional move. Long wick reversals are most meaningful when they have a confluence with other key technical levels like resistance and support or overbought and oversold readings. A long wick shows the failure of the chart to hold a key price level as buyers big up lows or sellers bid down highs.
What is a neckline candle?

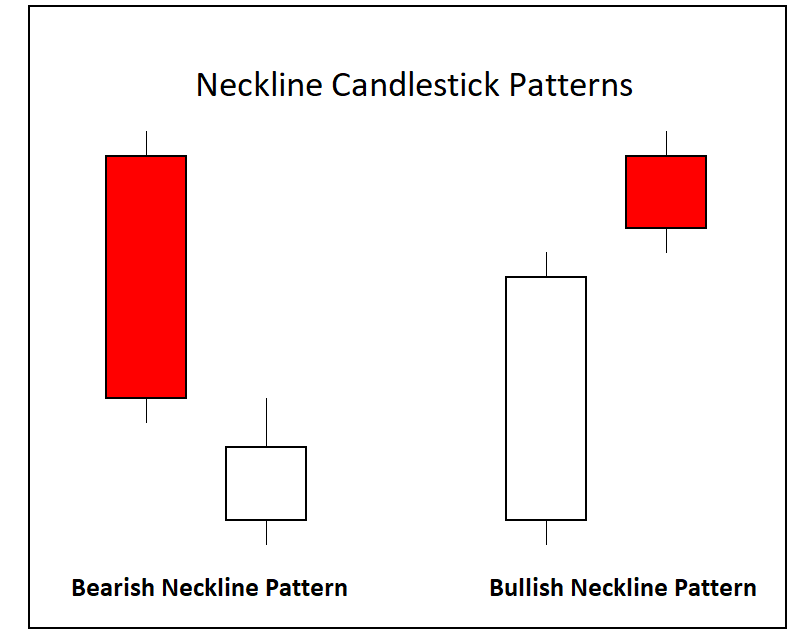
The neckline pattern or on neck pattern is a reversal signal for candlestick chart patterns. The large candlestick shows the primary momentum on the chart followed by a confirmation of the move holding the previous candle move neckline.
The bearish neckline candlestick pattern happens when a long bodied bearish candle is followed by a smaller bodied bullish candle that gaps down at the open but then reverses and closes near the prior bearish candle’s closing price.
The bullish neckline candlestick pattern happens when a long bodied bullish candle is followed by a smaller bodied bearish candle that gaps up at the open but then reverses and closes near the prior bullish candle’s opening price.
What is piercing pattern?

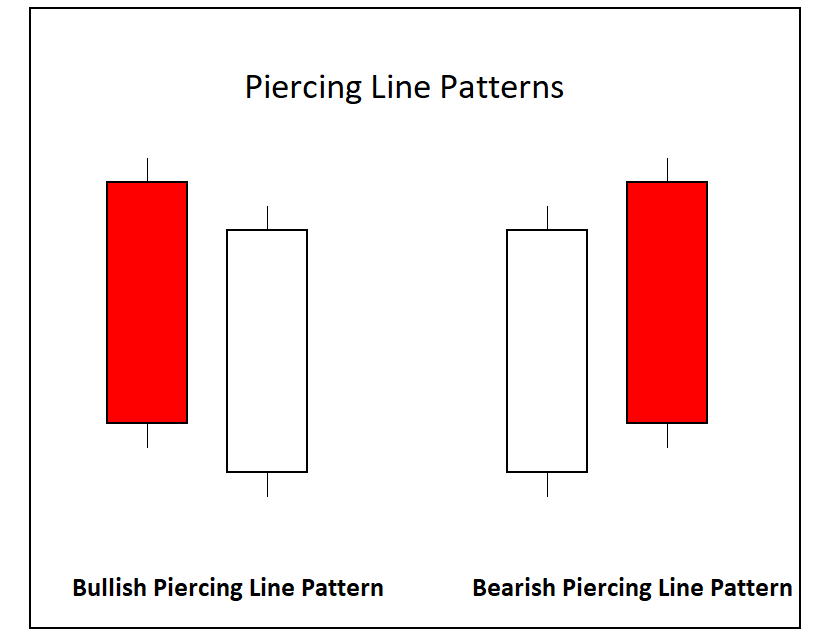
A piercing pattern is a two-day candlestick pattern that shows the potential for a short-term reversal on a chart by price action making a new low under or new high over the previous candle range but then moving back deep inside the previous candle after reversing.
A bullish piercing pattern is a move from a downswing to an upward reversal back inside the previous bearish candle. This pattern includes the first large candle opening near the high and closing near the low followed by the next candle making new lows but then reversing creating a big bullish candle.
A bearish piercing pattern is a move from an upswing to an downward reversal back inside the previous bullish candle. This pattern includes the first large candle opening near the low and closing near the high followed by the next candle making new highs but then reversing creating a big bearish candle.
The key principle to look for with reversal candlestick patterns is both a rejection of the current primary swing in price action followed by a move in the opposite direction showing a shift in momentum.
For a deep dive into learning all the most popular candlestick patterns you could see on charts, you can also check out my book: The Ultimate Guide to Candlestick Chart Patterns