Candlestick Patterns Explained
A candlestick is a type of chart used in trading as a visual representation of past and current price action…
Helping Traders Thrive
A candlestick is a type of chart used in trading as a visual representation of past and current price action…
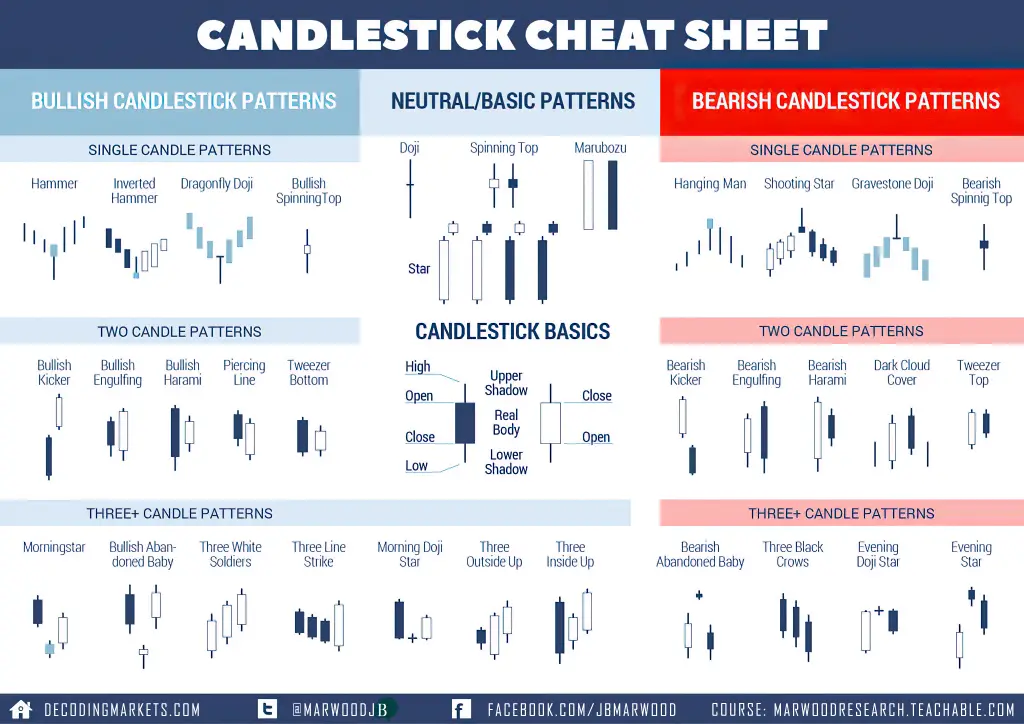
Here is the link to a free Candlestick Patterns PDF Guide created by Rayner Teo. A summary of what this…
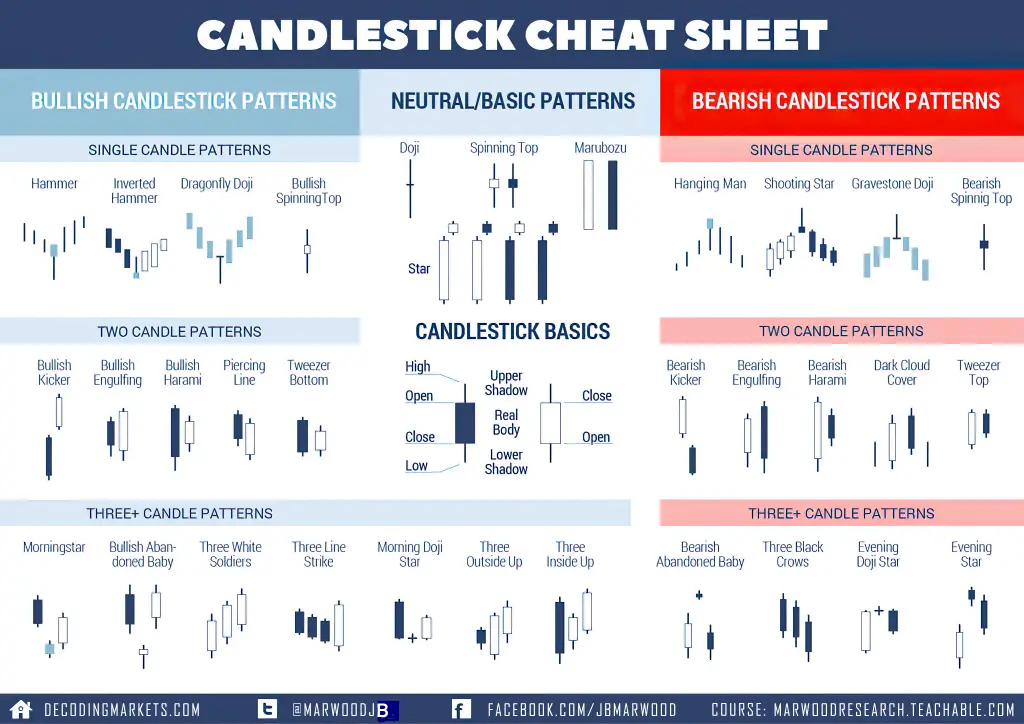
The Ultimate Candlestick Pattern Cheat Sheet How to Read Candlesticks A candlestick is a type of chart used in trading…
A candlestick is a type of chart used in trading as a visual representation of past and current price action…
Here is a visual index of all the most popular chart patterns used by traders to visually trade price action…
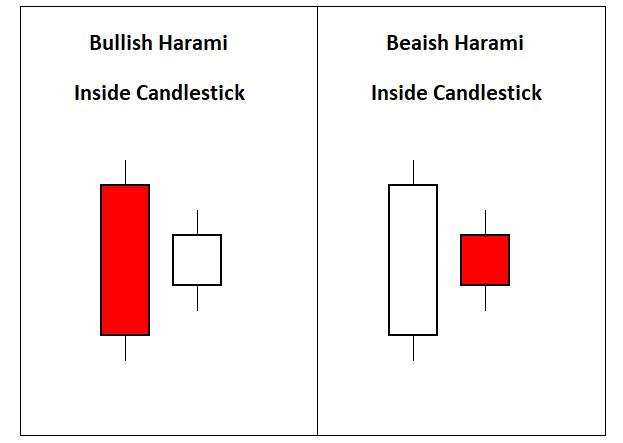
An inside candle pattern shows price is trading within the previous range of a time period. This candlestick pattern can show…
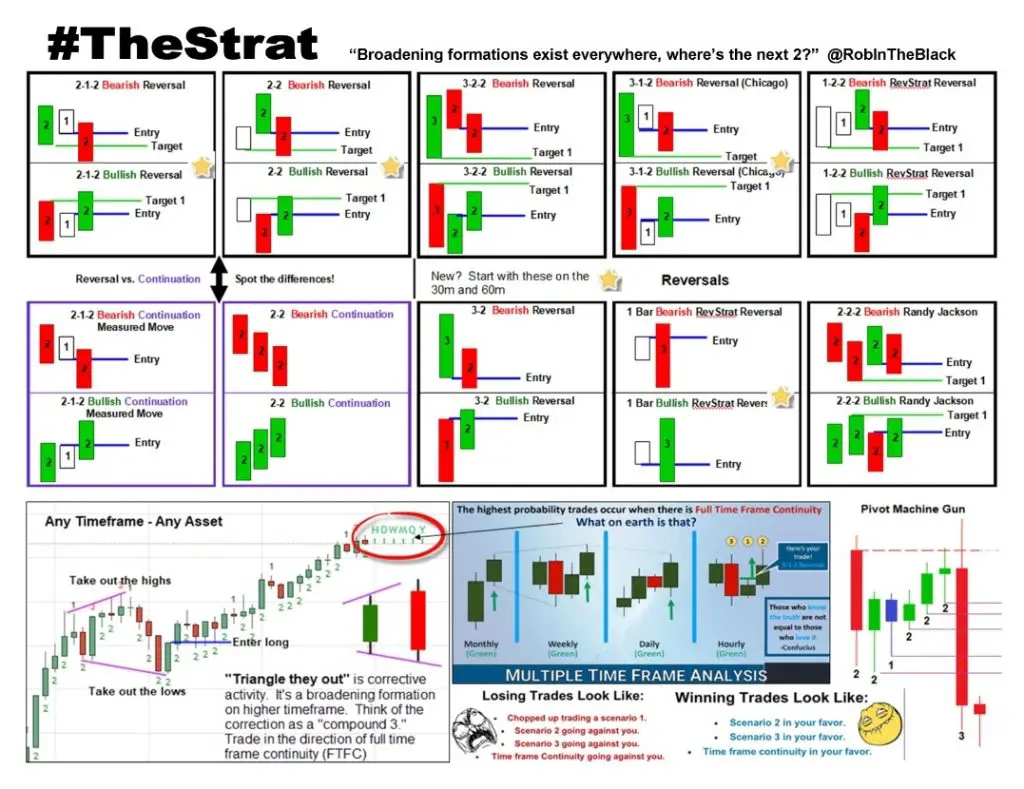
Here is the great candlestick patterns cheat sheet for Rob F. Smith’s The Strat that was created by Sara Strat Sniper…
An outside bar pattern is a two candle pattern that has a large candle engulf a previous smaller candle on…
Bullish price action trading creates chart patterns that show uptrends in a market through the buying pressure by traders and investors creating…
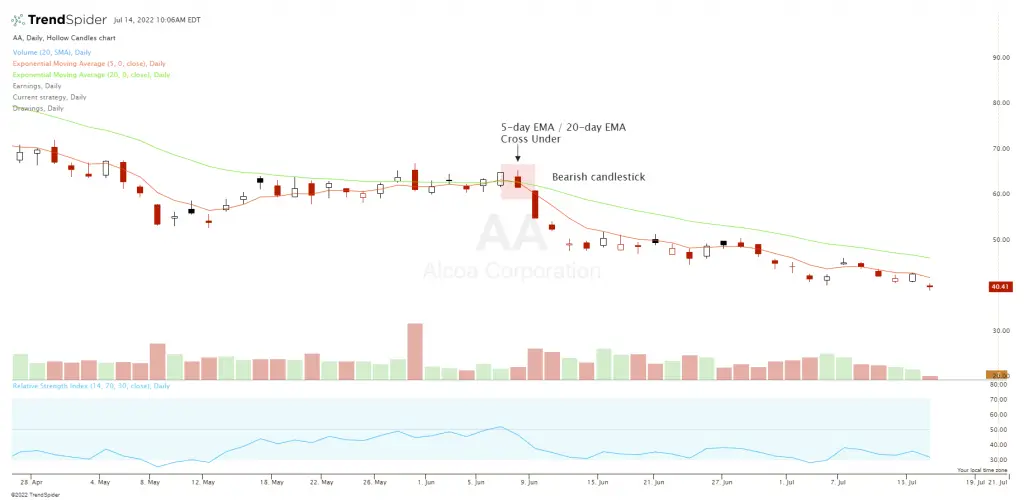
What does a black candlestick mean on a chart? A black candlestick forms on a chart set for hollow candles…